


Does Growth Matter? – India Multi Asset Commentary
Quantum Advisors India
Building your India portfolio since 1990 on a foundation of ethics, integrity & disciplined investment research process.
Oct 2, 2020The Growth versus Markets conundrum - markets have rallied despite growth slowing and corporate earnings flat. Does growth actually matter?
The Equity markets are back near all-time highs. GDP growth is at all-time lows.
This conundrum is not recent. For the last 5 years, we have seen equity markets rallying despite growth slowing and corporate earnings flat.
In this piece, we show through historical analysis that over the long term GDP growth indeed matters to corporate profits and stock market performance. Long periods of good stock market returns come through in periods where GDP growth is also rising and growing above its potential.
In the short run though several factors, including market liquidity, momentum, sentiment and global central bank action can drive valuations out of sync with macro fundamentals.
What we are more interested is, whether the premise of double digit equity market returns remains valid.
If long term stock market returns are based on long term economic growth, then should the investors worry if growth remains weak?
At Quantum, we are now working with an assumption of lower than 6% Real GDP growth over the next 5 years. This is below India’s long term average. This may have implication for future stock market return performance.
Table 1: Q India Multi Asset Summary, as at end August-2020
| Q India Multi Asset View |
Outlook | Recommendation | Key Trigger |
|---|---|---|---|
| Equity | Valuations are Stretched | Neutral Weight your long term India allocation | Fiscal Action for Growth Recovery |
| Fixed Income | DAS PUT in action; No Deep Rally | Stay away from Credit. Tactical on Duration | RBI Debt monetization. |
| Real Estate | Funding Stress will rise | Opportunities for Patient long term capital | Government Bail‑out |
| INR/USD | Dollar fall putting pressure on RBI to allow INR to appreciate | Depreciating Bias | Growth Recovery |
‘Indian Equity market returns will compound at 12%-15% over the long term’. This is a common exhortation by portfolio managers, investment advisors and financial planners to unsuspecting investors.
It is common, but has it been true? The BSE Sensex Index (Total Returns) since its inception in 1979 until August 2020 has returned 16.6% per annum; Impressive.
The 10 year returns though, not as much. If you look at the broader market, BSE 200, BSE 500 and the near term returns pale, below fixed income.
So how do market experts make that projection? Where does that 12%-15% number come from?
It comes from a simple arithmetic based on certain assumptions.
This is how we at Quantum have long derived our expectations of Indian Equity market returns.
Table 2: A Simple Equity Market Return Assumption
| Indian Equity Market Return Assumptions and Expectations | |
|---|---|
| GDP Growth, real | +6.5% |
| + Inflation | +5.0% |
| = GDP Growth, nominal | +11.5% |
| If GDP Growth = Revenue Growth (Revenues of Typical Companies) | +11.5% |
| Profit Growth of Typical Companies | +11.5% |
| Companies, listed and in an Index > Typical Company | +13.5% |
| Returns of An Intelligent Portfolio | +15.0% |
| Returns to a Foreign Investor (INR/USD) | +15.0% + (-2%) |
Source: Quantum Advisors, The numbers in the above table are based on the assumptions and estimates made by Quantum Advisors Pvt Ltd.. “An intelligent portfolio” mentioned above refers to a portfolio constructed by an investment manager following an active approach to investing with an appropriate research and investment process in selecting stocks
This is a simple estimate and not a rocket science. It makes a set of assumptions for the broader market:
- Stock market returns over the long-term mirrors the company’s profits
- The growth of a company’s profits will mirror the growth in the economy
- Well-managed companies will be able to grow it’s profits at a faster pace than the overall economy
- Professional Investors will be able to identify and invest in those well-managed companies.
This assumption and estimate is not restricted to use for Equity investing alone. What differs though is whether the estimate used is of the long term or the short term.
Indian businesses take capital investment decisions based on this assumption of long-term growth and inflation. The Indian government uses the short-term GDP estimate to forecast the taxes it will be able to collect in any year.
Equity Investing is for the long term. If the above table is valid, the long-term economic growth potential of the country should matter to equity investors.
A look at Table 2 and you know that the two most important determinants of long-term equity returns are a) Real GDP growth and b) Inflation.
You can now understand why we fret so much over the GDP growth number. Unfortunately, the hyperventilating is more on the short-term GDP growth estimate. We show later in this piece that in the short term, GDP growth and equity market returns may not be correlated. GDP growth number is backward looking; Equity markets price in future growth prospects.
The long-term estimate is based on the potential sustainable trend growth. This is difficult to estimate. But there are techniques, easy and complicated, to work out a fair guesstimate.
Chart 1: India Growth slips below potential
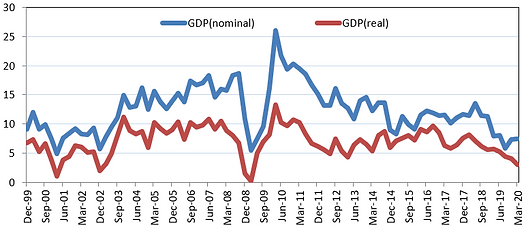
Source: CMIE, quarterly data, %yoy, data series is linked from different base years
In 2007, the International Monetary Fund (IMF) reviewed four academic research papers that had estimated India’s potential growth. The estimated potential real GDP growth in those 4 papers ranged from a minimum of 7.3% - a maximum of 9.8%.
The actual average Real GDP growth from FY 08 to FY 20 has been 6.2%. This by the way includes the bewildering high growth prints of FY 15-FY 18.
3 years of 9% real GDP growth between FY 06-FY 08 made everyone extrapolate India to be a sustainable double-digit Real GDP growth economy.
Quantum’s own long held (since 2007) but primitive long-term Real GDP estimate of 6.5% has turned out to be higher than the actual outcome.
Many called us Pessimists in 2007. With recent GDP growth below 5%, the same may now call us optimists.
If you think about it, much of the corporate debt problem that we have seen in the last few years can be traced to investments made with the assumption of +9% real GDP growth.
Do look at the share price graphs of some of the then marquee infrastructure and industrial companies. Or look at the list of the large companies that were referred to the bankruptcy proceedings by the Reserve Bank of India. All singed by growth assumptions not meeting expectations.
The growth being below expectations has manifold issues. As the chart above shows, India’s growth got severely impacted well before COVID. What was a twin balance sheet problem (Large Corporates and Banks) has now turned into a four balance sheet issue (Government and Individuals/Small Business):
- Bank’s NPA problems, which surfaced in 2015 remained unresolved; the NBFC and Real Estate crisis added to it since 2018. Thus corporate India and financial system was in in trouble.
- Demonetization and GST affected small firms, individual business owners, unorganized enterprises which showed up its impact as higher unemployment, slower consumption and lower investments.
- The government’s balance sheet (known from the fiscal situation) had been deteriorating as lower GDP growth led to lower taxes and thus higher government debt.
COVID, on top of all this is a perfect storm. The lockdown due to COVID has affected companies, banks/ NBFCs, small business and the government. - Most importantly, it has impacted the self-entrepreneur, the migrant labourer and to an extent the salaried class as well. Now the individual balance sheet is also under stress.
These are worrying issues which will take immediate tactical solutions and deep rooted structural remedies. This will take time to resolve and India’s potential growth itself may have gone down below 6%. We at Quantum, are working with this assumption of lower than 6% real GDP growth for the next 3-5 years.
How does this impact you? Going back to our earlier question – why do we fret so much over the GDP growth number?
Table 3: Growth Matters!
| % CAGR | GDP (nominal) | GDP (real) | Sensex EPS | Sensex Index | BSE EPS | BSE 500 Index |
|---|---|---|---|---|---|---|
| Mar 2003–June 2020 | 10.54 | 5.09 | 9.12 | 14.95 | 7.43 | 15.55 |
| Mar 2003–Mar 2011 | 15.32 | 8.66 | 15.93 | 25.18 | 17.28 | 26.47 |
| June 2011–June 2020 | 6.28 | 1.95 | 3.30 | 6.36 | -0.64 | 6.43 |
| Last 5 Years | 2.56 | -0.57 | 1.28 | 5.95 | -0.97 | 5.06 |
| Last 10 Years | 8.15 | 3.45 | 3.46 | 5.69 | 0.27 | 5.34 |
| Last 15 Years | 10.67 | 5.12 | 7.23 | 9.76 | 5.15 | 9.34 |
Source: CMIE, Bloomberg Finance LP; EPS = Earnings per share; CAGR = Compounded Average Growth Rate; Quarterly Data from Mar 2003 to June 2020
As the table above shows, GDP growth does matter to corporate profits and to stock market performance. India’s golden period (Mar 2003-Mar 2011) in terms of economic growth was also the best period for corporate profitability and stock returns. When growth slipped in subsequent years, so have profits and returns.
Using the June 2020 data as an end point, does impact this analysis, but not by much. Even on a 15 year period, there is enough to show that in the long term corporate profitability and hence stock market returns are linked to a large extent to macro-economic growth.
The correlations of GDP Growth with EPS and Index values also show a similar trend with correlations above the 70s in the short term and above ~90s in the long term. The same when done using % yoy analysis shows a lower correlation between GDP growth and stock market performance.
That % growth number perhaps explains the dichotomy and the short term trend of rising stock markets at a time when GDP growth is likely to be ~-10% for the full year FY 2020-2021.
In the next section, where we discuss the outlook on Equity markets, we will see why that might be the case. The table also raises the fundamental question: If growth is supposed to slow in the coming years, should we expect lower returns from Equities.
The sharp rebound in the equity markets since the bottom in March 2020 remains surprising to many. It isn’t an Indian phenomenon; there is a global rebound in stock markets. India’s equity market euphoria though is particularly challenging on two moot points:
- India has had amongst the strictest lockdown and COVID-19 cases yet remain on the rise
- India’s fiscal response when measured in terms of cash outgo has been the lowest
The (-)23% GDP fall for the quarter ended June 2020 is not the issue. The larger worry is the ~(-)10% GDP fall estimated for the full year 2020-2021. The last 3 years of slowdown, the fall in incomes, the increase in unemployment and now the economic impact of COVID – not ideal signs of equity market performance.
Chart 2: No Earnings, but P/E expansion
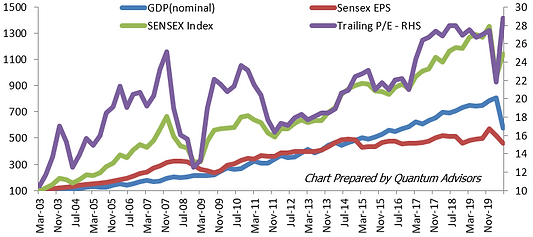
Source: Bloomberg Finance L.P, EPS, Index and GDP rebased to 100 – Mar 2003; Data till June 2020
As seen from Chart II, in the last five years, only P/E expansion has led to rise in Sensex. The earnings line is a flatline even below nominal GDP. Many have opined on this and below are our viewpoints on the same
- Companies listed and part of the BSE-500 form the better part of the economy and thus have stronger balance sheets to gain market share from the unlisted/unorganized segments.
- Investors are pouring in money into these companies based on this formalization trend as evidenced by increasing flows into MFs and the rising P/E ratios of these companies
- Within the Sensex and the BSE-500 there is similar polarization and a few stronger and larger companies have a large impact on index performance.
- Companies are more linked to the global demand and supply cycle
- The global rate cuts and liquidity easing benefits these larger companies
Chart 3: The Indian Saver drives up Equity valuations
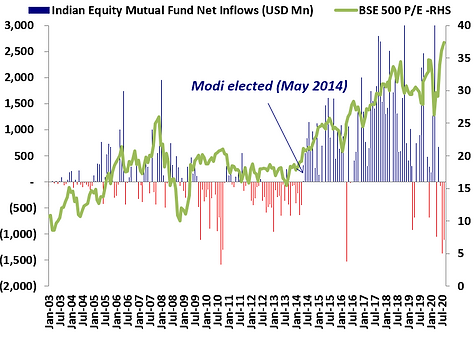
Source: Bloomberg Finance L.P, SEBI, Data till August 2020
Quantum’s Value Equity strategy newsletter details this macro and market conundrum of lower growth, lower earnings and high market index levels. However, the strategy cash level of 11%, a shade below its long term average does indicate that there is value outside the index and despite the index valuation reflecting near peak.
- In the very near term, with virtually zero earnings visibility, equities are likely to be driven by A) success or failure of outcomes of policies dictated by a government that is still not coming to grips with the economy’s real problems, and B) fears of disruption caused by the virus. If the market is disappointed, we believe a 20% correction in USD terms is possible as the PE for the SENSEX has almost gone back to its highs.
- The long-only, bottom-up value portfolio we have nurtured is trading at a substantial 53% discount to the historical PER valuation of the Index. For now, our work indicates a 36% Upside Potential over 2 years. We suggest neutral weight.
Table 4: A truly Value Portfolio with margin of safety
| Metric | Q India Composite | S&P BSE 30 TRI |
|---|---|---|
| Number of stocks | 29 | 30 |
| Historical PER of portfolio (T12M) | 15.2x | 31.2x |
| Wt of stocks with PER < 20, historical | 57% | 23% |
| % Wt of stocks with PER > 20, historical | 43% | 77% |
| % Wt of stocks with PER > 30, historical | 14% | 46% |
Source: Quantum Advisors, Bloomberg Finance L.P, As of August 31, 2020.Historical PER, both for portfolio as well as the benchmark, have been computed using the Aggregation Methodology.There is no assurance or indication that this portfolio characteristic will be sustained in future.
Table 5: Quantum Value Equity Summary View – Neutral allocation after market rebound
| Indicator | Our Reading of the Indicators | Our View on expected outcome / possible course of action |
|---|---|---|
| Valuations | Elevated (See chart II) | Cautious on the Index – opportunities elsewhere |
| Flows | Locals holding on but showing first signs of nervousness | Local nervousness may remove cushion from any foreign selling |
| Economic Activity | Slow pick up | Removal of lockdown, and migrant laborers coming back to cities could reactivate the economy |
| Earnings | Not much visibility | Sell-side will downgrade March 2021 estimates |
| Upside Potential estimate of the Strategy | 36% over the next years | At our 14-year average of 36% |
| Downside risk estimate of the market/portfolio | Limited downside given portfolio valuations; however, markets tend to overshoot/undershoot in both directions on account of sentiments and flows |
Foreign selling could trigger a slide but local buying may support; FX risk |
| Suggested Allocation | July 2020: 75% to 100% of what you wish your long-term exposure to be; Neutral changed from the earlier recommendation of March 2020: 100% to 125%; Over-weight |
Invest for the long-term upside, and be ready to add more when markets decline |
Source: Quantum Advisors
Fixed Income is more closely linked to macro developments. Inflation and fiscal deficit are the two major drivers of fixed income returns. High inflation and high fiscal deficit impact bond returns and vice versa.
There are times though, where the Central Bank prioritizes growth over inflation and deficits. During downturns, they thus cut rates, add liquidity and boost bond returns. We are seeing that trend playing out now.
Governor Shaktikanta Das’s exhortation of ‘whatever it takes’ to revive growth has seen the RBI cut rates by more the 2% (200bps), add ~9.0 trillion of excess liquidity and use unconventional tools like LTROs, Operation Twist to get market yields lower. In our newsletter, we look at whether like the Greenspan PUT, is there a Das PUT in the Indian Bond markets.
Chart 4: Growth Slowdown and COVID-19 makes RBI slash interest rates
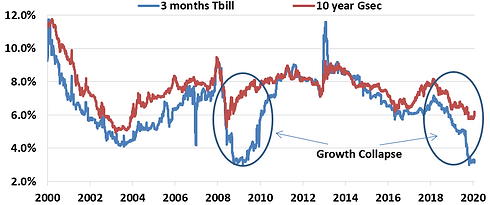
Source: Bloomberg Finance L.P, Data till August 2020
Why don't interest rates remain low for long in India?
Indian bond yields are at historic lows. Indian interest rates are near all-time lows. If you look at the 20 year chart of the Indian 10 year bond yield, the levels below 6% do not sustain for too long. The average during this period is 7.57%. This chart is also volatile and broadly ranges between 5% and 9%.
Between 2015 and 2019, when India followed Inflation targeting, the 10 year bond ranged between 6% and 8%. Over the last year, the RBI has turned its focus to growth and as the chart shows it has kept the Repo Rate well below CPI inflation. Bond yields have thus broken below the 6% level.
In 2004 and 2009 look at the rise in yields once the bond yields touched all-time lows of about 5% yield. The yield rise in both cases was all the way up to 9% over a 4 year period. Such large up move in yields were negative for the bond returns on both the occasions.
2004-2008: the yield rise was primarily driven by higher growth and followed by a very late cycle inflation. Overall a good outcome, as an asset allocation shift to equities would have managed the lower returns from fixed income
2009-2013: the initial rise in yields was purely an outcome of the increase in fiscal deficit. The centre’s fiscal deficit exploded from 3% of GDP to 6%; while at the same time RBI had to catch up to the very high CPI inflation by aggressive rate hikes.
A bad outcome as fixed income returns fell, equities didn’t do well and we eventually ended up with a currency crisis.
We Don’t See a Deep Bond Rally: Lower your return expectations
We are not saying that this time will be the same. But it is important to understand the investing risks if it so happens. Also, it is important to understand what factors then drove the bond yields higher. We see the fiscal risk present for now, but inflation also has remained stubborn despite the growth collapse.
Table 6: Bond Returns came down in periods after low rates
| Period | Yield Move (10-Year G-Sec) | Daily Average 10-Year G-Sec Yield | CRISIL Composite Bond Fund Index | CRISIL Short Term Bond Fund Index | CRISIL Liquid Fund Index |
|---|---|---|---|---|---|
| Oct 2003 – July 2008 | 5.1% → 9.3% | 7.1% | 3.3% | 5.1% | 5.7% |
| Dec 2008 – Oct 2011 | 5.2% → 8.9% | 7.6% | 4.8% | 6.2% | 5.9% |
Source – Bloomberg, Finance LP, AMFI Portal, Quantum Research; Table shows the annualized returns of debt fund indices during the rising yield cycles of 2003-2008 and 2008-2011. Data are taken on monthly closing basis to calculate the returns. This is shown only for illustration purpose. Past performance may or may not sustain in future.
For more information and if you wish to discuss the details in the newsletter or if you wish to know more about our investment strategies, the investment philosophy and investment opportunities, please contact:
Arvind Chari – [email protected]
Arvind Chari is the Chief Investment Officer (CIO) at Quantum Advisors. Arvind’s vast experience in managing money for global investors and his interactions with leading institutions has exposed him to a world of knowledge. With over 21 years of experience in tracking domestic and global economy he is Quantum’s thought leader and is the author of this Q-India Insight edition.
*While we shall comply with all applicable regulations and it is our endeavor to follow industry best practices for the benefit of all our clients, non-US persons and investors in our non-US funds should take note that registration of QAPL as an investment adviser with SEC does not imply any level of skill or training. that our non-US clients are entitled to the full benefit of all substantive provisions of the Investment Advisers Act 1940 (Advisers Act) or that we are required to comply with all the provisions of the Advisers Act in our dealings with our non-US clients, including non-US funds. We will thus have responsibilities under the Advisers Act that differ from client to client, based on whether or not the client is a non-US client”.
This article is strictly for information purposes only and should not be considered as an offer to sell, or solicitation of an offer to buy interests in the account. Investments in the equity and fixed income instruments are not guaranteed or insured and are subject to investments risks, including the possible loss of the principal amount invested. The value of the securities and the income from them may fall as well as rise. Past performance does not guarantee future results and future performance may be lower or higher than the data quoted, including the possibility of the loss. Quantum Advisors reserves the right to make the changes and corrections to its opinions expressed in the document at any time, without notice. Information sourced from third parties cannot be guaranteed or was not independently verified.
Comments made herein are not necessarily indicative of future or likely performance of the account and are based on information and developments as at 31/08/2020 unless otherwise stated.
All of the forward-looking statements made in this communication are inherently uncertain and Quantum Advisors (QAPL) cannot assure the reader that the results or developments anticipated by QAPL will be realized or even if realized, will have the expected consequences to or effects on, us or our business prospects, financial condition or results of operations. A prospective investor can generally identify forward-looking statements as statements containing the words “will,” “should”, “can”, “may”, “believe,” “expect,” “anticipate,” “intend,” “contemplate,” “estimate,” “assume”, “target”, “targeted” or other similar expressions. Readers are cautioned not to place undue reliance on these forward-looking statements in making any investment decision. Forward-looking statements made in this communication apply only as of the date of this communication. While we may elect to update forward-looking statements from time to time, we specifically disclaim any obligation to do so, even if internal estimates change, unless otherwise required by applicable Securities law
Related Post

The Inflation Tantrum: Q India Asset Allocation Insights
A macro look at global investor allocation to Indian asset markets as the world frets over Inflation.
Modi Sheds His Fiscal Conservatism: India 2021 Budget Outlook
The government has shocked the bond markets and cheered the equity markets with its new budget - will increased spending spur growth?
Investing Insights 2021: Themes and Trends
2020 has been a year of facing, learning and adapting to the unknown. We look to the year ahead and what is to come.
India Macro: The Impossible Trinity
India's macro-economic policy leaders tackle the trilemma dilemma of capital mobility, exchange rate management and monetary autonomy.
Our Strategies
Explore how our two main strategies – Predictable India Equity and India Integrity Equity - with demonstrated success of our tried and tested research and investment processes can ensure your India equity allocation will have higher predictable outcomes and no surprises.
Q India Value Equity Strategy
20+ years of India Long-only, Liquid, High-Governance, Margin of safety = Predictability
Integrity screen since 1996, strategy Track record since 2000.
Q India Responsible Returns Strategy
Liquid, proprietary Integrity Scores, Financial Soundness
Integrity Screen since 1996, enhanced criterion since 2015, strategy Track Record since 2019; strategy AuM: $9.7 mn Mandate Capacity: $5 billion
Quantum Advisors pioneered a quantitative as well as qualitative analytical approach to equity investing in India, providing for the first time, consistently applied valuation metrics to evaluate investment opportunities in India’s emerging stock markets. Over the years, Quantum Advisors has continued and enhanced its tradition of extensive financial analysis and value investing, as it has evolved into an investment advisor and asset manager.
Our investment philosophy and strategy involves the use of intensive qualitative and quantitative fundamental analysis. We build and monitor our clients’ portfolios actively while at the same time avoiding excessive trading, and control risk by endeavoring to keep our clients’ portfolio adequately diversified, both in terms of the sectors included in those portfolios, as well as with respect to the level of concentration in any specific security.