QASL Logo

SAVE MY WORLD

Time is Running Out For Climate Action.

Building your India portfolio since 1990 on a foundation of ethics, integrity & disciplined investment research process.


Climate change is global, solutions need to be too.

Record breaking temperatures this year as well as historic floods have underlined the urgent need for concerted action by global asset allocators to create a 'Save My World' Bucket in their investment portfolios.

The coal and oil that fuelled growth and security may be being replaced with green energy in the West but the rest of the world will continue to rely on dirty energy. So if developing countries cannot cut back on carbon emissions quickly, gains made in richer countries will be overwhelmed by higher emissions elsewhere. Since poorer but rapidly growing countries do not have the financial resources to keep up the green energy race, climate disasters will continue to devastate the world.

To solve this global problem will require a universal solution too. The huge stock of wealth in richer countries could be tapped to redress the balance

Not just Governments but businesses, pensions, foundations and endowments could commit just 1% of their funds to invest in potential climate solutions for the developing world.

We call it the ‘SaveMyWorld’ investment allocation bucket.

Time is Running Out for Climate Action

Who will fund the world's needed response to Climate Change? An allocation of just 1% by pension funds and SWF would avert a global crisis.

As we look back on the year 2023 and as we look forward to 2024, we see some similar worries, similar expectations, some hope and newer concerns.

#SAVEMYWORLD Bucket

Industrialisation Induced Climate Chaos

The Developed World’s consumption patterns account for around 90% of greenhouse gases emitted since the Industrial Revolution. The UN IPCC report just published pre-COP26 says we are even closer to a climate emergency than previously thought and turning this around could take centuries!

AUM $9.7 Mn, Capacity $5 Bn

Summary of global temperature and carbon dioxide trends
" The chart titled “Atmospheric carbon dioxide and Earth’s surface temperature (1880–2019)” shows global surface temperature anomalies and atmospheric carbon dioxide concentration over time. Vertical bars represent the annual difference from the 20th-century average temperature. Blue bars indicate years cooler than the average, which are common from 1880 through the mid-1970s. Red bars indicate years warmer than the average and dominate from the late 1970s onward, increasing in height through 2019. A grey line represents atmospheric carbon dioxide concentration measured in parts per million. Carbon dioxide levels rise from about 285 parts per million in the late nineteenth century to over 410 parts per million by 2019, with a faster increase after the mid-20th century. The chart shows that as atmospheric carbon dioxide concentration increases, global surface temperatures also rise, highlighting a strong long-term relationship between the two."

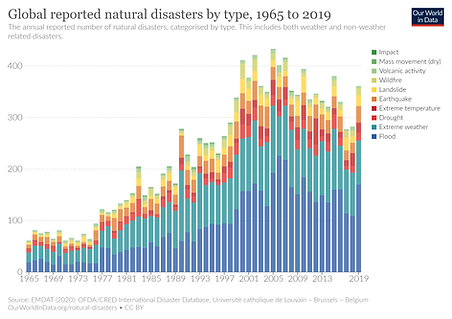
Climate Disasters Proliferate

This year’s hugely destructive droughts, deluges, floods and fires across the World are already telling us we do not have that time. Climate related disasters are global - they do not discriminate on the basis of nationality or respect borders.

Summary of global natural disaster trends by type
" The chart titled “Global reported natural disasters by type, 1965 to 2019” shows the annual number of reported natural disasters worldwide, broken down by disaster type. Each year is represented by a stacked bar showing floods, droughts, extreme weather, earthquakes, landslides, wildfires, volcanic activity, dry mass movements, and impact events. The total number of reported disasters rises from fewer than 100 per year in the late 1960s to more than 400 per year around the early 2000s. Floods and extreme weather events account for the largest share of disasters and increase substantially over time. Geological events such as earthquakes and volcanic activity remain relatively stable. After peaking around 2005 to 2010, the total number of reported disasters declines slightly but remains much higher than in earlier decades."

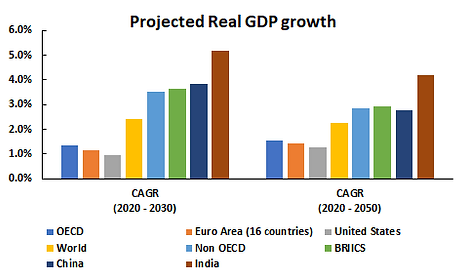
Emerging Markets Fuel Global Growth

Richer countries are now racing to replace fossil fuels with renewables in the quest for GHG reduction targets. Poorer countries do not have the resources to keep up with that race, much as many are trying. This too when they also have legitimate aspirations for economic growth from their growing populations

Projected real GDP growth rates by region
"The chart titled “Projected Real GDP growth” shows projected compound annual growth rates for major regions and country groups over two periods: 2020 to 2030 and 2020 to 2050. For the 2020 to 2030 period, India has the highest projected growth at just over five percent, followed by China, BRIICS, and non-OECD countries with growth between approximately three and four percent. The world average is around two and a half percent, while OECD countries, the Euro Area, and the United States have growth rates close to one to one and a half percent. For the longer 2020 to 2050 period, growth rates decline for most regions. India remains the fastest growing at just over four percent. Non-OECD countries, BRIICS, and China grow around three percent, while OECD countries, the Euro Area, and the United States remain below two percent. Overall, the chart shows stronger long-term growth prospects for emerging economies compared with advanced economies."
 Why Adani demonstrates the G should come first in ESG at least in India
  • July 02, 2024
Why Adani demonstrates the G should come first in ESG at least in India

The Adani situation and its potential impact on India's reputation and financial system. 

 Eyewash, Hogwash and Greenwash (EHG) – The Trilemma of ESG Investing
  • July 02, 2024
Eyewash, Hogwash and Greenwash (EHG) – The Trilemma of ESG Investing

We examine a growing trend amongst corporations: a diminishing focus on Environmental, Social, and Governance (ESG) initiatives. A recent... 

 From E to S, India ESG Increasingly Looking at Social Concerns Too
  • July 02, 2024
From E to S, India ESG Increasingly Looking at Social Concerns Too

Self-assessment and proactive engagement lead our approach towards a sustainable future, underlining the harmony of 'planet and people'. 

 2023 - Climate Evidence Will Force a Resurgence in Sustainable Investing
  • July 02, 2024
2023 - Climate Evidence Will Force a Resurgence in Sustainable Investing

After a challenging year for ESG investing in 2022, marked by setbacks and declining interest, the focus now shifts to 2023. The recent... 

Our Strategies

Explore how our two main strategies – Predictable India Equity and India Integrity Equity - with demonstrated success of our tried and tested research and investment processes can ensure your India equity allocation will have higher predictable outcomes and no surprises.

Q India Value Equity Strategy

20+ years of India Long-only, Liquid, High-Governance, Margin of safety = Predictability

Integrity screen since 1996, strategy Track record since 2000.

AUM $2.5 Bn Capacity $10 Bn

Q India Responsible Returns Strategy

Liquid, proprietary Integrity Scores, Financial Soundness

Integrity Screen since 1996, enhanced criterion since 2015, strategy Track Record since 2019; strategy AuM: $9.7 mn Mandate Capacity: $5 billion

Quantum Advisors pioneered a quantitative as well as qualitative analytical approach to equity investing in India, providing for the first time, consistently applied valuation metrics to evaluate investment opportunities in India’s emerging stock markets. Over the years, Quantum Advisors has continued and enhanced its tradition of extensive financial analysis and value investing, as it has evolved into an investment advisor and asset manager.

Our investment philosophy and strategy involves the use of intensive qualitative and quantitative fundamental analysis. We build and monitor our clients’ portfolios actively while at the same time avoiding excessive trading, and control risk by endeavoring to keep our clients’ portfolio adequately diversified, both in terms of the sectors included in those portfolios, as well as with respect to the level of concentration in any specific security.

QASL Logo
Building your India portfolio since 1990 on a foundation of ethics, integrity & disciplined investment research process.
Linked In
Important Disclosure: Quantum Advisors provides a direct onboarding option to clients who wish to avail our services, without intermediation of persons engaged in distribution services.
© 2024 Quantum Advisors

Quantum Advisors Private Limited

CIN: U65990MH1990PTC055279
SEBI PMS Reg. No.: INP000000187

Registered Office

1st Floor, Apeejay House,
3 Dinshaw Vachha Road, Backbay Reclamation,
Churchgate, Mumbai 400020, India
Tel: +91-22-6144 7900 / 22830322
Fax : 91-22-2285 4318
Email: [email protected]

In case of any grievance/complaint, you may contact Mr. Piyush Thakkar, Chief Executive Officer at [email protected]. Investor can initiate dispute resolution by harnessing online conciliation and/or online arbitration through Online Dispute Resolution (ODR) portal SMARTODR. To know more about grievance redressal mechanism click here.

Learn more about our strategies, insights and investment process

Contacts:

Arvind Chari

Chief Investment Strategist
Contact: +44 7340 046532

Roger Mortimer

Director – International Business Development
Contact: +44 7947 242769

Our affiliates:

Q India (UK) Limited

14th Floor, 33 Cavendish Square, London W1G 0PW (U.K.)

Q India Corp. (U.S.A.)