


The Great India Under-Allocation
How Foreign Investors are missing out on India’s Growth Story by allocating through global emerging markets.
The most common response to our reach outs to prospective Global Investors to get them interested in Indian Equities is ‘We do not make single country allocations’.
The fact that they do not invest in single country is of course not true. Global investors have standalone allocations to the United States. It is often the largest weight in any global portfolio.1
The US commands approximately a 65% weighting in global equity indices, punching much above its share of Global GDP at around 26%.2 However, US corporations and markets are unparalleled in their influence, impact, and importance to the global investing world. Thus, a single-country allocation to the US is very much justified.
The conventional asset allocation includes Equities, Fixed Income and Alternatives Within each of these asset classes, there are allocations to Home Country, Global/International Developed World, Emerging Markets, and Single Country allocations.
As expected, a major portion is allocated to Home Country and Developed World. The share of Emerging Market and Single Country allocations remains a small portion of an overall global portfolio.
Emerging Markets (EMs) make up more than 50% of world GDP,3; however, their weight in the MSCI All Country World Equity Index (ACWI) is around 10%.4 In most global equity portfolios, the EM allocation tends to be below 10%.5
The allocation has dropped even further in the last few years (see chart 1 below). Given the continued underperformance of Emerging Markets relative to world markets (see chart 1 below), portfolios have automatically seen a decrease in weighting to EMs. Additionally, repeated geopolitical and governance concerns over certain EMs with large weights in the index, (such as Russia, China, Brazil, Turkey, etc) have impacted investment sentiment forcing many investors to withdraw from some of these markets.
Other reasons for this trend may include slower growth and depreciating currencies due to a stronger dollar, leading to further negative sentiment and thus outflows or lower inflows to EMs.
Chart 1:Foreign Investors are shying away from Emerging Markets
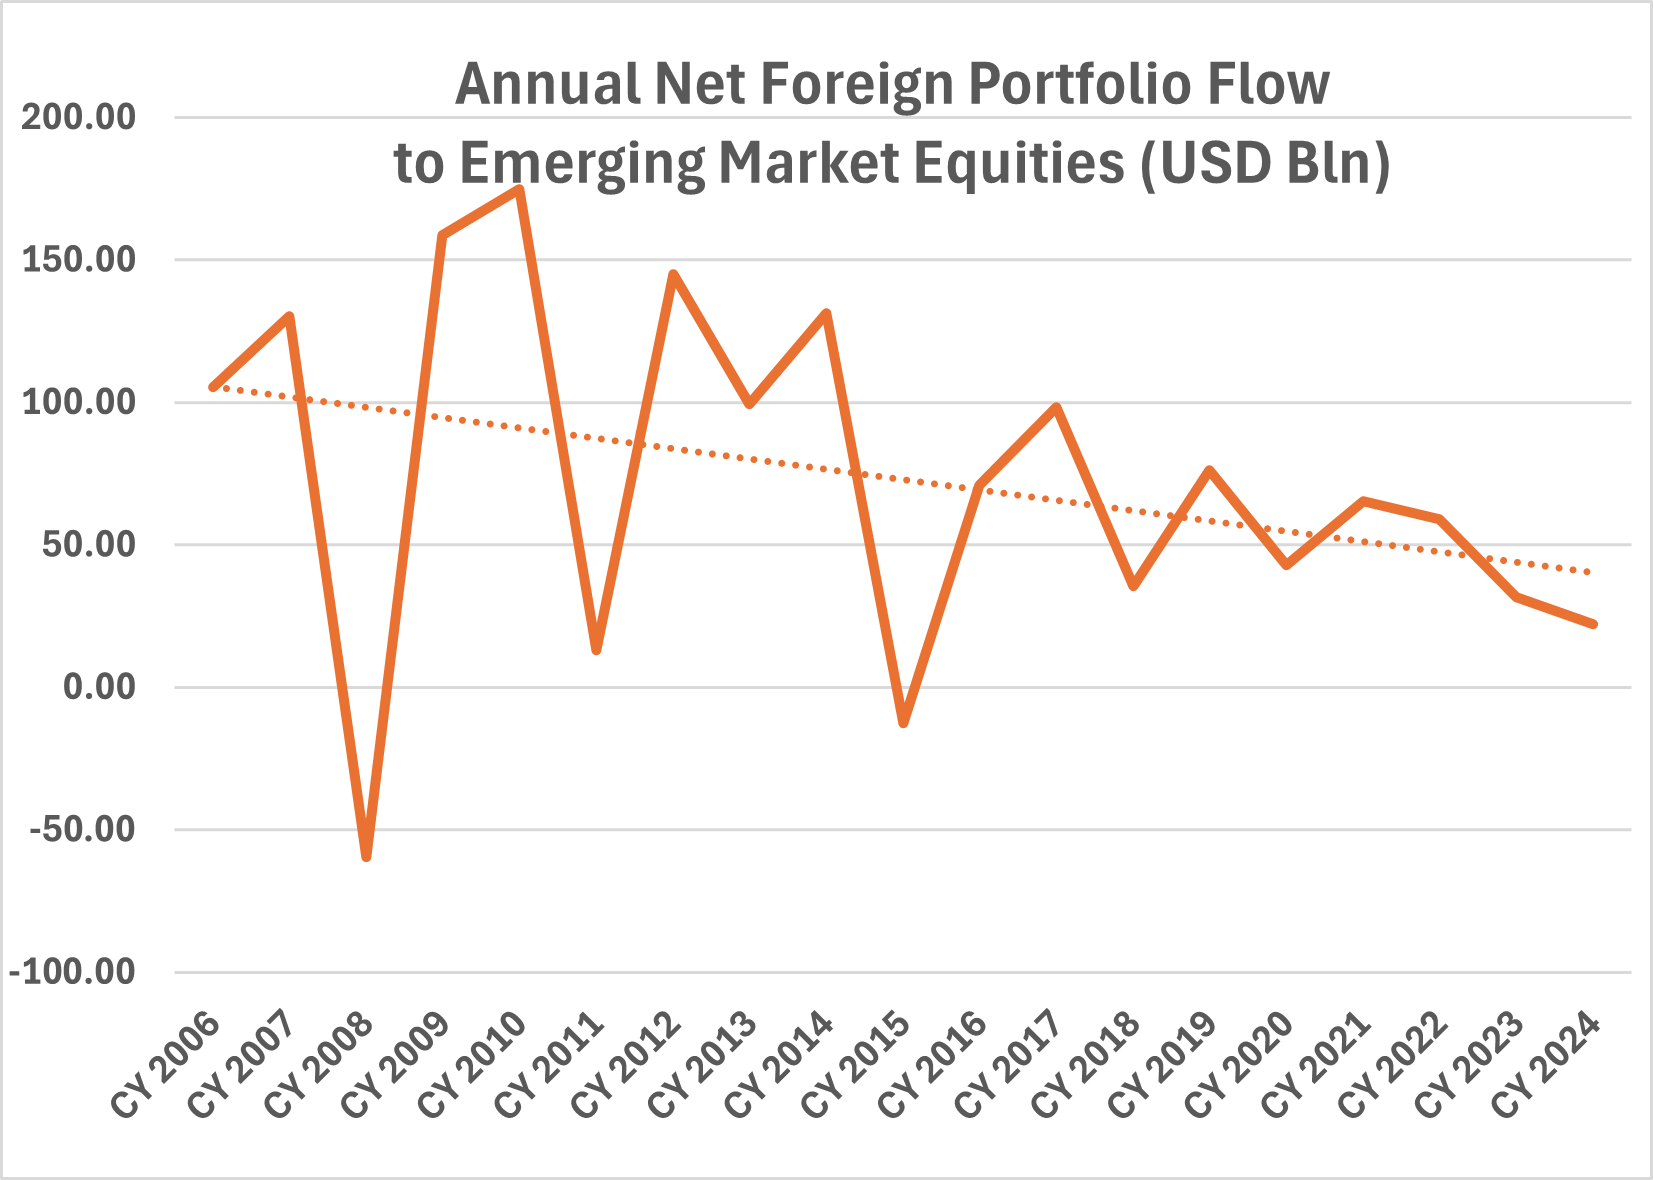
(Source:BIS, IMF BOP Monitor, Annual Data till CY 2024; Foreign Portfolio flows to Equities)
Annual Foreign Portfolio flows to Emerging Market Equities have dropped from an average of around USD 100 billion to below USD 50 billion. For a group, that represents around 50% of global GDP, this seems like a shockingly low number.
India is considered as part of the Emerging Markets and an important one at that. India’s relative growth, improving access to foreign investors and better corporate performance has meant that India’s relative share in the MSCI Emerging Markets Equity Index has risen from around 7% a decade ago to almost 20% 6
Using data from chart 1 and 2, on a cumulative basis, EM Equities have seen approximately USD 1,380 billion in total foreign flows since 2007. Over the same period, Indian Equities have seen around USD 176 billion in net flows, accounting for 12% of total EM flows.
There have been years, such as 2020 and 2023, where India received over 50% of EM flows. Conversely, there have also been years when India experienced outflows despite overall net inflows to EMs.
Chart 2:Foreign Flows to India are constrained by overall flows to Emerging Markets
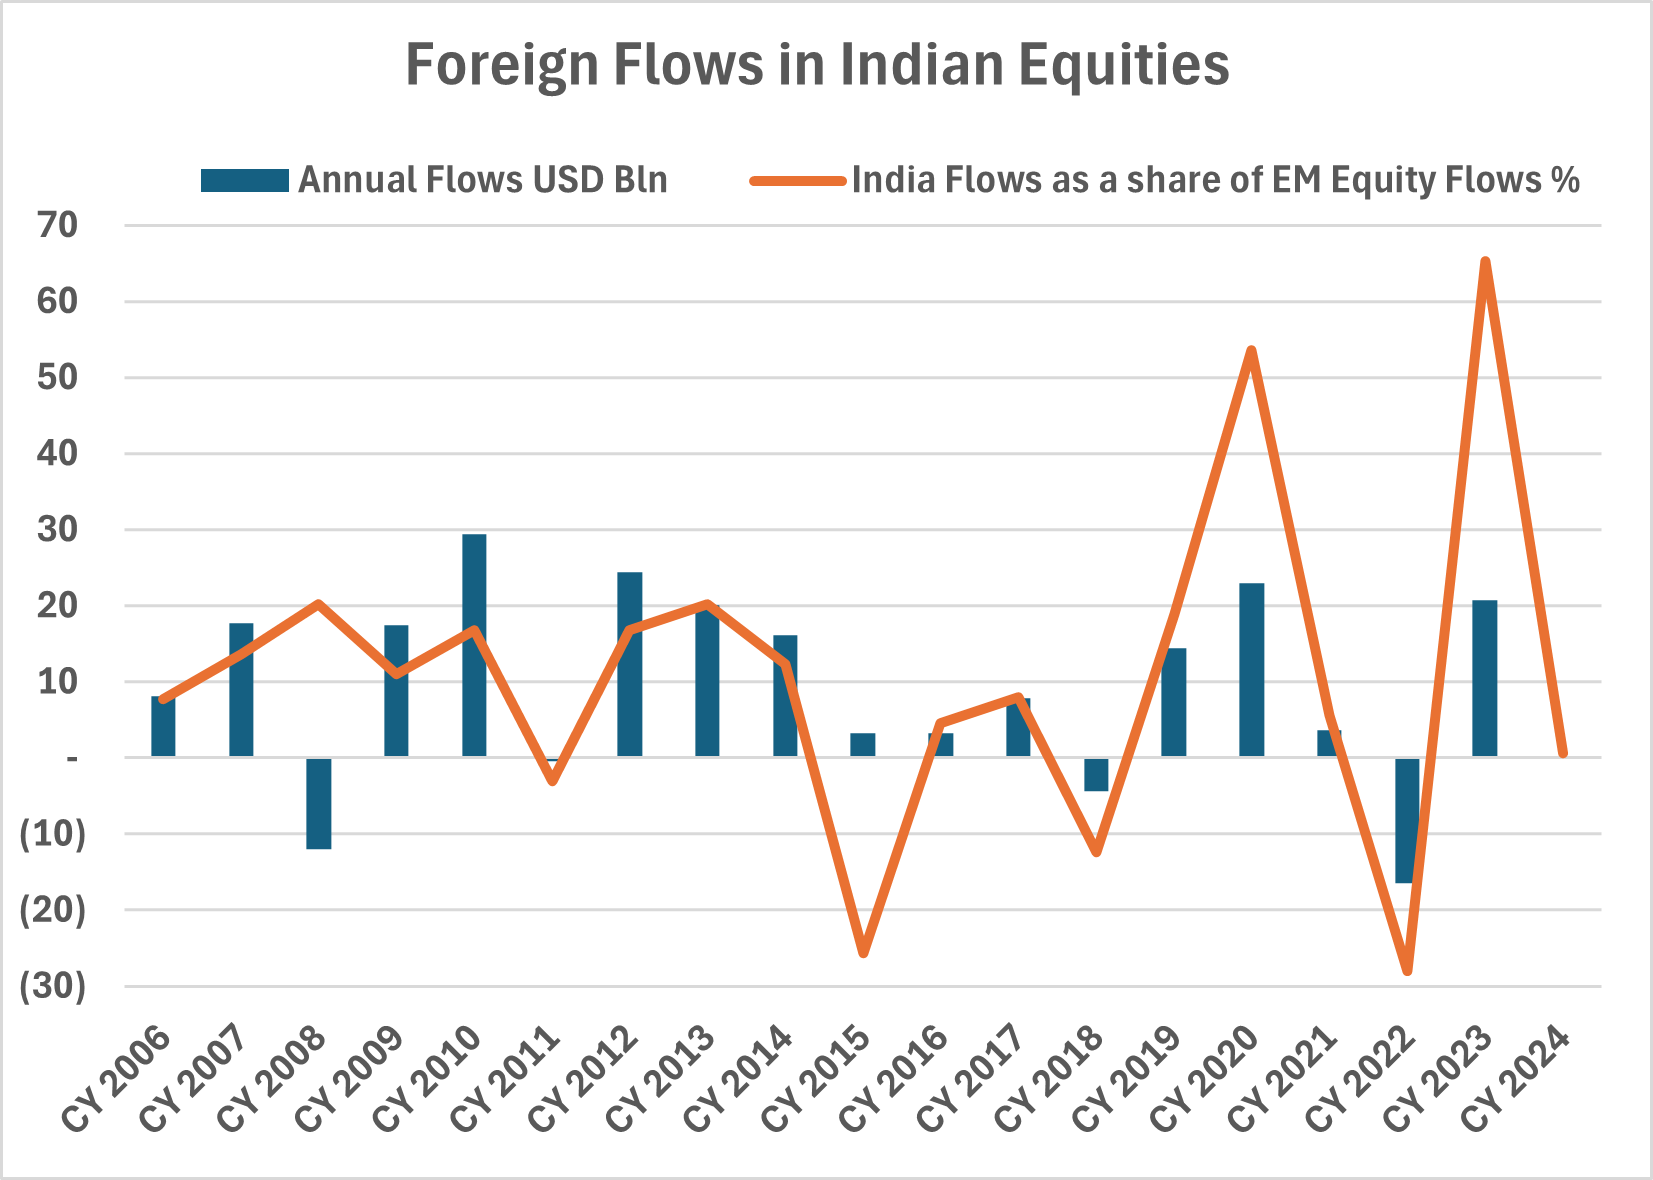
(Source: FPI NSDL Monitor, BIS, IMF, Annual Data till 2024; Read y-axis as USD bn and as % for both the series);
CY 2024 India portfolio number is USD 0.12 billion and hence not visible on the chart)
Emerging Markets have Under-performed; India bears the brunt by out-performing!As you can see, flows to India from global investors are constrained by their overall sentiment towards allocating to EMs.
For instance, if portfolio equity flows to EMs were USD 150 billion per year, India should hypothetically receive USD 30 billion per year (20% of 150) in equities just from global investor allocation. The only calendar year India received equity portfolio flows of that absolute amount was in 2010!
Thus, despite India’s relative outperformance, we did not see as much allocation as expected.
We believe, given the longer-term outperformance of Indian equities, India has seen net outflows of over USD 27 billion over the last year, as investors have rotated out of India to other markets, given that the overall pie is not growing significantly.7
Since CY 2021, as evidenced from the chart below, foreign flows to India equities are a negative ~USD 6 billion and buying by Indian mutual funds over the same period has been a staggering ~USD 145 billion. Spurred by the disciplined buying power of monthly systematic investment plans (SIP), Indian retail investors now have invested more in net terms in Indian equities than foreign investors. (see chart 3 below for cumulative data since 2003)
Chart 3:India Domestic Investors: ‘We Don’t Need No Foreign Investor’!
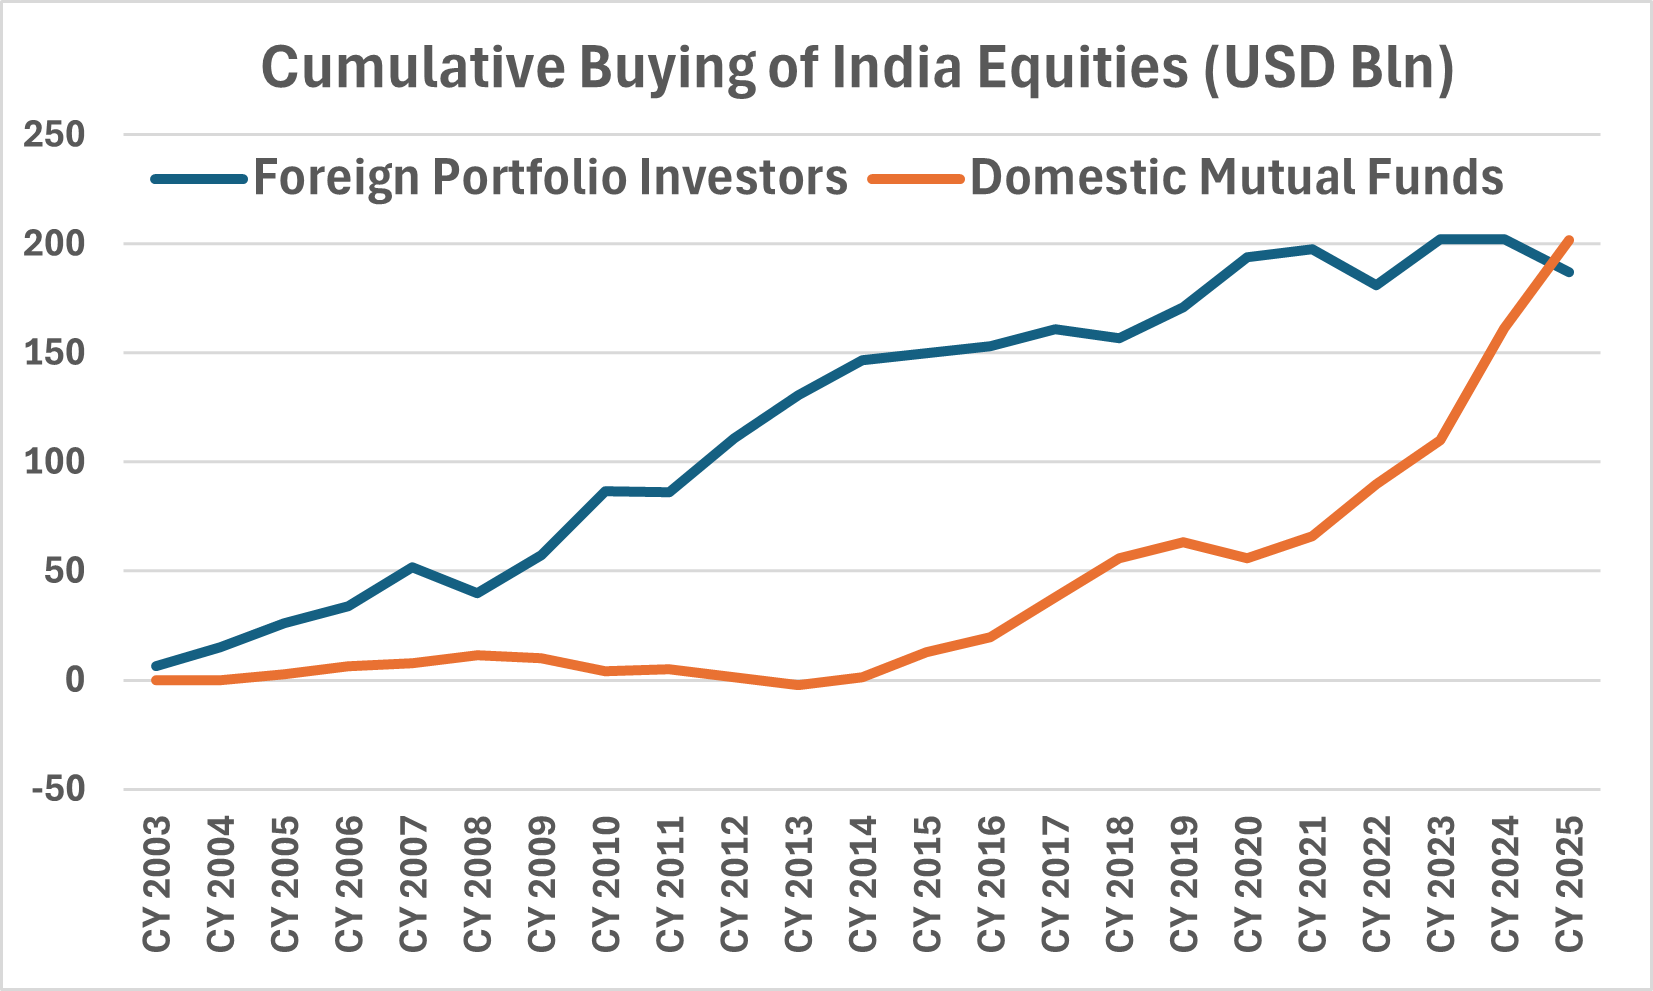
(Source: Bloomberg Finance L.P, NSDL, SEBI, Calendar Year Data, CY 2025 till August 2025, The cumulative buying number is at cost)
Given the continued underperformance of EM equities compared to Developed markets, global investors are making a prudent decision by allocating less than intended to EM equities. However, by categorizing allocations into such buckets, global investors remain underweight in EM and, consequently, underweight in India.
As a result, global investors are missing out on India’s growth story, which is reflected in Indian public equities.
Table 1:Foreign Investors are missing out on India Opportunities by remaining under allocated
| MSCI Index | 1 Year | 5 Year | 10 Year | 20 Year | 25 Year |
|---|---|---|---|---|---|
| MSCI A CWI World Index | 15.3% | 12.5% | 11.7% | 8.7% | 6.8% |
| MSCI Emerging Markets Index | 17.7% | 5.7% | 7.4% | 6.6% | 7.4% |
| MSCI India Index | -9.6% | 14.0% | 9.5% | 9.3% | 10.1% |
(Source:Bloomberg Finance L.P, MSCI; Gross Returns in USD); Above 1 year returns are annualized, Returns as at 29th August ; Past performance does not guarantee future return. This is only for representation and understanding purpose and should not be construed as a recommendation to invest.
Global or EM allocation dominate foreign ownership in India.
We estimate that approximately 20% of overall foreign ownership is through India dedicated flows.
Global Financial AuM is estimated to be ~USD 305 trillion.8 We categorise investors into Institutional Asset Owners (AuM ~USD 119 trillion) and Individuals, saving and investing through banks, wealth managers or asset management companies (AuM ~USD 185 trillion)
To that, we have added a column to show Investments in Indian public equities by these investor categories. As of June 2025, the market value of foreign portfolio investors (FPIs) in Equities was approximately USD 858 billion. (See table 2 below)
Foreign Investors have thus invested less than 0.3% of Global Financial AuM in Indian equities.
Table 2:The Great India Under-allocation; India Dedicated Investments ~ 20% of overall holdings
| Investor Category | AuM (USD Billion) |
Investment in India Public Equities (USD Billion) |
India Equity as a % of Global AuM |
|---|---|---|---|
| AuM with Asset Owners (A) | 119,200 | ||
| Global Pension Funds | 63,000 | 78 | 0.12% |
| Insurance Companies | 40,200 | 11 | 0.03% |
| Central Banks/ Sovereign Wealth Funds /Governments | 13,700 | 137 | 1.00% |
| Endowments/ Foundations | 2,300 | 7 | 0.30% |
| AUM with Individuals and AMCs (B) | 185,800 | ||
| Individuals - invested through Banks /Investment Managers | 116,900 | 625* | 0.34% |
| Asset Management Companies (AMCs) | 68,900 | ||
| Global Financial AuM (A+B) | 305,000 | 858 | 0.28% |
(Source:BCG Global Wealth Report, 2025, Thinking Ahead Institute, BCG Report on AMCs, NSDL FPI Monitor – Data as at June 2025; Quantum Advisors categorisation of NSDL data to relevant Investor category as listed above; * - Also includes USD 17 billion of investor category listed as corporates and others)
Our categorisation shows that Investments made by entities categorised in the NSDL data as Foreign Asset Managers/Investment Funds/Investment Advisors/Investment Managers (~USD 625 billion) dominate the ownership with 70% of overall India holdings.
Data sourced from Bloomberg shows that offshore domiciled India dedicated equity funds total about USD 130 billion in assets under management. This suggests that approximately 20% (130/625) of above category invested in India are through India dedicated equity funds.
The rest are India allocations made by AMCs/Investment Funds/Advisors which have a global, emerging market or Asia focus.
The Asset Owner category shown above own in total as per our categorization USD 233 billion of India equities with a 27% share. (233/858)
As with the AMCs/Investment Funds/Advisors category, we estimate, given lack of clear data on this, we estimate that a similar 20-25% of flows by Asset Owners are India-dedicated.
We thus estimate that India-dedicated investments, whether through funds, direct investing, or managed by investment managers like Quantum Advisors, would be about USD 200 billion, or 23% of total foreign equity investments.
The rest of the allocation is through global/EM/Asia or other regional funds or mandates, which remain dependent on overall asset allocation decisions and other aspects of investability, risk, sentiment, and career risks for allocators choosing a single country.
We believe that Foreign Investors are under-invested by over a trillion dollars in India public equities If you consider 40% as the usual allocation to Equities 1 (the global market portfolio referred in sources and notes number 1 shows that estimate), then taking USD 305 trillion as global financial AuM, the total investments in equities would be ~USD 120 trillion.
India foreign holding at ~USD 858 billion, is less than 1% of global equity allocation. India’s weight in MSCI ACWI is ~2%.4 Even on that basis, the current ownership is underweighted by more than 1% or by more than a trillion dollars.
Chart 4 :India’s weight in MSCI ACWI of ~2% is a lagging indicator of opportunity 4
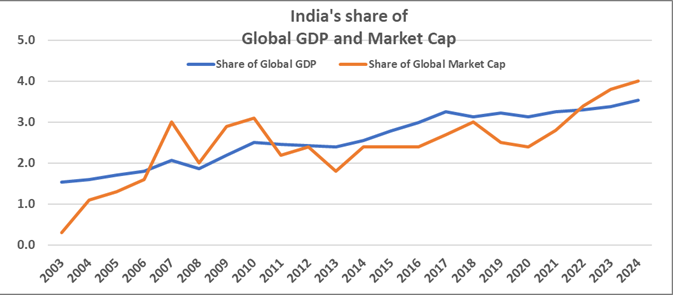
(Source: GDP and Market Cap chart is from IMF and Bloomberg; Annual Data till 2024; y axis is %)
Another way to assume is to consider one-third of the global AuM to be investable outside the home country. The investable amount then is assumed to be USD 100 trillion (1/3 of 305 trillion)
We have argued that given India’s link between GDP growth and equity market returns, weighted allocation in global portfolios. If the India weight in global portfolio needs to be 5%, then the value of foreign holdings to India needs to rise to ~USD 5 trillion. (5% of 100 trillion)
As we see an increase in India dedicated Investments, flows to India would increasingly be determined by country’s prospects, governance, rule of law, attractiveness, growth, ease of entry and exit, taxation policies and other local factors.
Flows to India from global investors then need not be constrained by overall flows to Emerging Markets or on global generic asset allocation trends.
Global Allocators thus need to think about dedicated allocations to India. We believe that India Public Equities should be a standalone, strategic allocation in global portfolios.
Sources and Notes:
- Sizing up the Global Market Portfolio, MSCI, November 2024
- How much exposure to US Stocks, Article in Financial Times, May 2025
- World Economics
- MSCI ACWI IMI Geographical Breakdown, April 2021
- How much to own in EM, Morgan Stanley, 2021
- India changed and changing equity markets, MSCI, July 2024; Can India Benefit out of US single country risk – Article by Quantum Advisors, March 2025
- India records highest FPI outflows in Asia, National Herald, September 2025
- Global Wealth Report, BCG, June 2025
Important Disclosures & Disclaimers
Quantum Advisors Private Limited (QAPL) is registered in India and holds a Portfolio Management License from Securities and Exchange Board of India (SEBI), India vide registration number INP000000187. It is also registered with the Securities Exchange Commission, USA as an Investment Adviser and a Restricted Portfolio Manager with the Canadian Provinces of British Columbia (BCSC), Ontario (OSC), and Quebec (AMF). It is not registered with any other regulator. (Note: Registration with the above regulators does not imply any level of skill or training).
The views expressed herein shall constitute only the opinions and any information contained in this material shall not be deemed to constitute an advice or an offer to sell/purchase or as an invitation or solicitation to invest in any security. Further, Quantum Advisors Private Limited (QAPL) and its employees/directors shall not be liable for any direct or indirect loss, damage, or liability whatsoever arising from the use of this information.
Information sourced from third parties cannot be guaranteed or was not independently verified. Whilst no action has been solicited based upon the information provided herein, due care has been taken to ensure that the facts are accurate, and the views given are fair and reasonable as on date. All forward-looking statements made in this communication are inherently uncertain and we cannot assure the reader that the results or developments anticipated will be realized or, if realized, will have the expected consequences to or effects on us, our business prospects, financial condition, or results of operations.
Readers are cautioned not to place undue reliance on these forward-looking statements in making any investment decision. Forward-looking statements made in this communication apply only as of the date of this communication. While we may elect to update forward-looking statements from time to time, we specifically disclaim any obligation to do so, even if internal estimates change, unless otherwise required by applicable securities laws.
This article is for educational and discussion purposes only and is not intended as an offer or solicitation for the purchase or sale of any investment in any jurisdiction. No advice is being offered nor recommendation given.
Recipients should exercise due care and caution and, if necessary, obtain professional advice prior to taking any decision based on this information.
Important Notice:
This newsletter contains hyperlinks to websites operated by third parties. These linked websites are not under the control of QAPL and are provided for your convenience only. Clicking on those links or enabling those connections may allow third parties to collect or share data about you. When you click on these links, we encourage you to read the privacy notice of the website you visit. QAPL does not endorse, or guarantee products, services or advice offered by these websites.
Our Strategies
Explore how our two main strategies – Predictable India Equity and India Integrity Equity - with demonstrated success of our tried and tested research and investment processes can ensure your India equity allocation will have higher predictable outcomes and no surprises.
Q India Value Equity Strategy
20+ years of India Long-only, Liquid, High-Governance, Margin of safety = Predictability
Integrity screen since 1996, strategy Track record since 2000.
Q India Responsible Returns Strategy
Liquid, proprietary Integrity Scores, Financial Soundness
Integrity Screen since 1996, enhanced criterion since 2015, strategy Track Record since 2019; strategy AuM: $9.7 mn Mandate Capacity: $5 billion
Quantum Advisors pioneered a quantitative as well as qualitative analytical approach to equity investing in India, providing for the first time, consistently applied valuation metrics to evaluate investment opportunities in India’s emerging stock markets. Over the years, Quantum Advisors has continued and enhanced its tradition of extensive financial analysis and value investing, as it has evolved into an investment advisor and asset manager.
Our investment philosophy and strategy involves the use of intensive qualitative and quantitative fundamental analysis. We build and monitor our clients’ portfolios actively while at the same time avoiding excessive trading, and control risk by endeavoring to keep our clients’ portfolio adequately diversified, both in terms of the sectors included in those portfolios, as well as with respect to the level of concentration in any specific security.