


Quantum Advisors India
Building your India portfolio since 1990 on a foundation of ethics, integrity & disciplined investment research process.
Can India Grow at 7%?
The answer to this proverbial question on India's potential growth rate depends on the period in which the question was asked:
- If asked in the 1980s - the hopeful answer would have been 5%.
- In the 90s, post liberalization, hopes had risen for a sustainable 6% growth rate.
- In the 'Goldman Sachs - BRIC' mania of 2004-2011, it was India's birth right to grow at 9%.
- Morgan Stanley's 'Fragile Five' in 2013 smothered it down below 8%.
- 'Ache Din' in 2014 raised hopes of 8% again.
- In 'Atma-Nirbharta', many seem to be settling for 6%.
In 2007, as a young analyst at Quantum, I had argued on the structural changes and the opening up to foreign investments to raise our internal long-term real GDP estimate to 6.5%-7.0% from 6%.
In 2018, my team made a presentation on 'what will it take for India to grow at 8%'?, while retaining the 6.5% level.
Pre-Covid, the last 10 year average is 7.0%. We shave off 1.0%-1.5% from that number to account for the over-estimation in the new GDP series that Arvind Subramanian, the ex-CEA wrote about.
In March 2020, we estimated that India's long term GDP potential may have fallen below 6.0%.
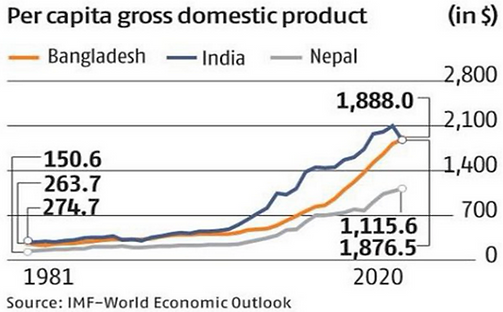
Chart 1 : Will India settle for a 6% growth?
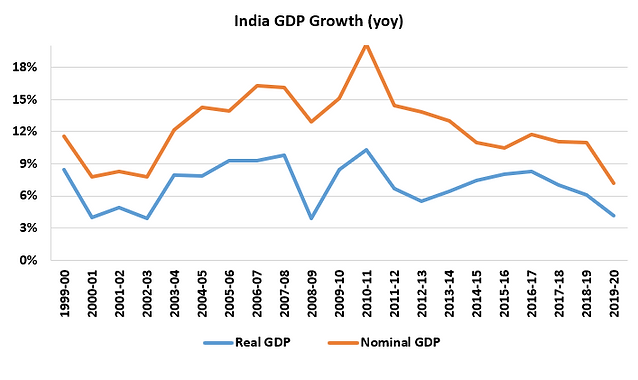
Source: CMIE, Quantum Research, Annual Data till March 2020
In an earlier insight piece , we spoke about why Growth matters to markets. Long term returns from Equities, Infrastructure and Real Estate are very closely linked to the long term growth cycle.
More so, it is the expectations of the long term growth which drives investments. Hence, maintaining and sustaining the long term growth potential is crucial for investment sentiment.
Investments Drive Growth
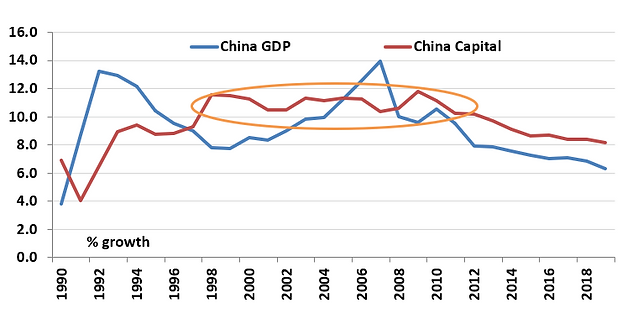
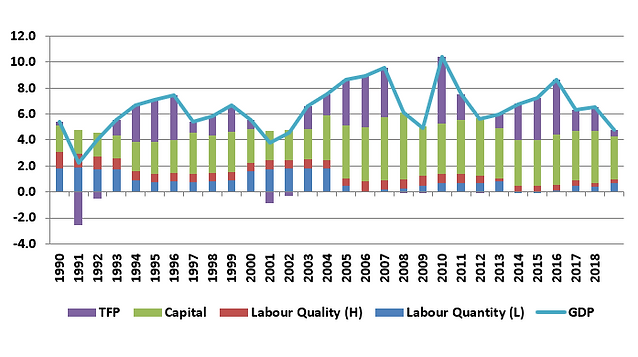
Chart 2 & 3: : India needs 10 years of 10%+ investment growth
Source:
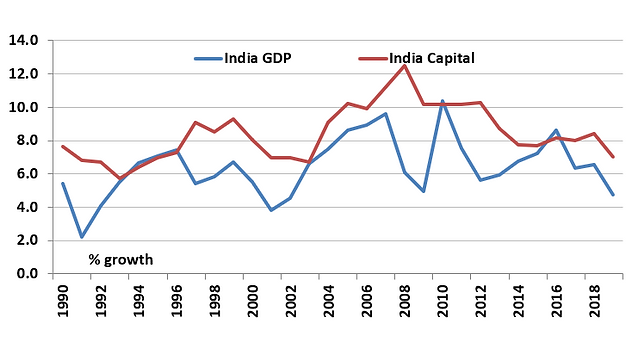
Source: Total Economy Database, July 2020 release, GDP growth (natural log), growth in total capital
The Asian economies starting from Japan in the 60s, South Korea in the 70s-80s and then China in the 90s-00s: all managed to havedouble digit GDP growth for many years in a row. The common driver was increase in investments in manufacturing and infrastructure, followed by increase in exports and a sustained rise in per-capita incomes.
India's step up in investment rate has driven growth but it hasn't sustained.
High investments led by the state have ended up in high fiscal deficits leading to macro stability issues.
High investments by the private sector in mid 90s and in 00 have resulted in a bad loan problem creating a financial stability issue.
India's politicians and policy makers haven't found a way to ensure sustainable long-term growth.
GDP = C + I + G + X - M
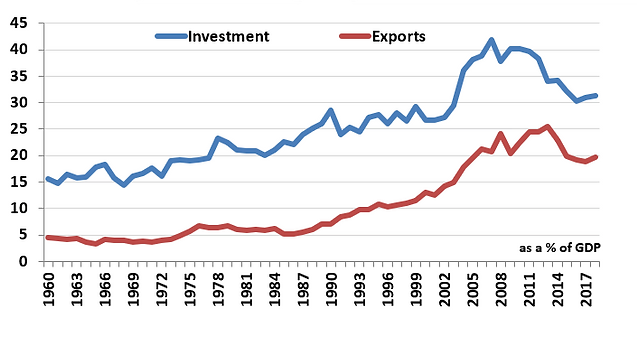
Sustainable long term growth is a function of I (Investments) and X (Export). Emerging economies which have grown and broken out of the low income into middle income have all done it by investing, producing at large scale and exporting.
India's private Consumption(C) and Government Expenditure (G) make up 60% of GDP but as the chart on the right shows, India's consumption base though large in numbers and as a share of GDP but as a potential market size it remains small.
Chart 4 & 5: Exports have been a big driver; domestic market small as incomes remain low
Source:
Source: CMIE, Annual Data till 2019, google images
Billion People but no Billion Consumers
The recent brouhaha over Bangladesh catching up with India on a $ per capita basis suggests India's consumption challenge. The 1800$ per capita is an average thus suggesting many millions who earn well below that level. We may bicker over whether the measurement should be PPP based or actual $, but that chart should make it clear that a population of a billion plus people does not mean a market of a billion plus for all goods and services.
Many estimates put India's discretionary consumption base between 150-250 million, the subsistence base at ~800-900 million and the poor at ~300 million.
India's PPP per capita income growth trajectory is below that of Japan, South Korea and China when compared for relevant 20 year growth periods.
India needs more investment and exports to drive growth and incomes, not consumption.
The Labor Quantity and Quality Challenge
Ajit Dayal, Founder & Member Portfolio Team, Quantum Advisors in an investor newsletter, "Where are the Jobs?" - 2010:
"The real risk to India, in our opinion, remains its growing population. What the Goldman BRIC report of 2004 described as the India demographic advantage, could turn out to be the curse? To create 150 million jobs over the next 15 years till 2025, the government in India needs to put in place policies that will create an average of 27,397 jobs every day for the next 5,475 days. That, to us, is the biggest challenge. What worries us, though, is that the government spending on job creation is not part of a stated long term plan.
Chart 6 & 7: The Demographic Curse?
Source:
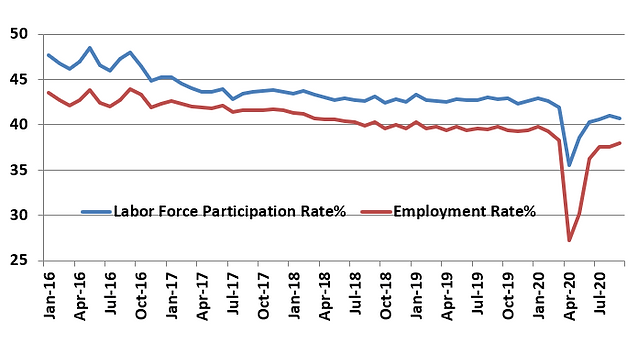
Source: Total Economy Database, July 2020 release, CMIE
The employment situation has gotten worse. As Chart VII shows, Indian economy and its informal workforce suffered a major blow post the shocks of demonetization, GST and the continued credit crisis. India's Labour Force Participation rate and the employment rate have fallen consistently over the last 5 years. Employment Rate was below 40% before COVID well below other Asian economies.
The slowdown in the economy is now due to both fall in capital and a fall in employment. This is a dangerous sign and if not remedied, will leave India struggling to break out of a low income country.
Since the 1990 reforms, the 6% real GDP growth in India was a given. It no longer is; We estimate India's potential growth to be below 6% from FY 22-FY 25.
The only policy focus of the government for the next 10 years needs to be to increase Investments, Create Jobs and Skill its workforce, else India may well be on the path to a breakdown nation.
Market Impact if Long term Growth lower than expected:
If growth remains weak; 6% real GDP growth/10% nominal GDP growth, investors will have to calibrate the long term returns for various asset classes.
As we showed in Why Growth Matters to Markets newsletter, long term returns from equities, real estate and infrastructure depends a lot on the base level of growth.
For assets which are sensitive to interest rates, an initial period of low growth leads to low interest rates. Thus fixed income investments, Real Estate Investment Trusts (REITs), long term infrastructure assets appreciate in value.
But a prolonged growth slowdown, will keep interest rates low and hence diminish the value of fixed income. Look at the low to negative yielding interest rates in much of the developed world today. Thus investors would need to lower their return expectations from fixed income and yield instruments.
Equities and Credit, if the slowdown is viewed temporary, will fund support with the low interest rates and excess liquidity that the central bank created.
However, in a growth country like India, a prolonged slowdown or growth below potential will reflect in lower corporate profitability and hence a potential de-rating of equity valuations.
Table 1: Q India Multi Asset Summary

Much of India's internal economic problems have been brewing for the past 3 years, and the pandemic has exacerbated the situation. In brief, the primary issues are:
- Distress in rural India, a fire ignited by the demonetisation of November 2016. This forced many rural poor to borrow to survive, and put them in a debt-servicing trap. While rural areas haven't been hit as hard in the covid-19 related lockdown, demand is yet to recover fully from past shocks;
- Lower aggregate demand in urban and rural India as a result of the demonetisation which suppressed corporate profits and gave little incentive to industry to invest in new capacity - this resulted in lower job creation and lower aggregate incomes and fed into further distress in a vicious cycle;
- The government's self-imposed fiscal constraints, driven by the admittedly real concern that reckless profligacy could do irreparable harm to the INR and bond yields, seems to have overridden any practical considerations amidst the new pandemic reality. As a result, the budget and relief measures have been targeted far more at ensuring liquidity remains available in the system, as opposed to measures that would immediately stimulate the flagging demand side of the economy.
- The bankruptcy of financial intermediary IL&FS in September 2018 and the unwinding of peak unsold inventory in the residential real estate markets have created another headache of illiquidity and mistrust of the financial intermediaries - the fact that the state-controlled banks were cleaning up the muck in their own balance sheets further complicated the flow of money within the economy.
Residential Real Estate - A Mixed Bag
Overall sentiment remains weak but there are some bright spots. Sales have picked up in completed projects as well as a handful of new projects launched by established players. The large listed players are benefitting more from this increased activity: on a year-on-year basis, average residential sales volume for large listed players fell by 43% versus an 80% drop for the sector as whole. Depending on the city, enquiries are back to 50% to 70% of pre-COVID levels.
Low home loan rates, cut in stamp duty rates (in certain cities), consolidation of real estate developers and completion of existing projects are seen to be major reasons for why enquiries and sales have picked up.
However, the key for real estate pick up is the improvement in the employment trends. Headline employment seemed to indicate happier times, with the unemployment rate dropping from 8.35% in August to 6.67% in September. The drop was underpinned by a sharp drop in the labor force participation rate, indicating workers have given up looking for decent jobs. On that front, quality of employment remains concerning, as an estimated 21 million salaried employees (out of a prior base of 86 million) had lost their jobs as of the end of August.
Within that sub segment, higher paid white-collar professionals (which includes software engineers, physicians, teachers, and accountants) experienced the sharpest loss with 6.6 million jobs cut. Industrial workers fared next worst, with a loss of 5 million jobs, as distress in the micro, small, and medium enterprise (MSME) segment in particular has perpetuated.
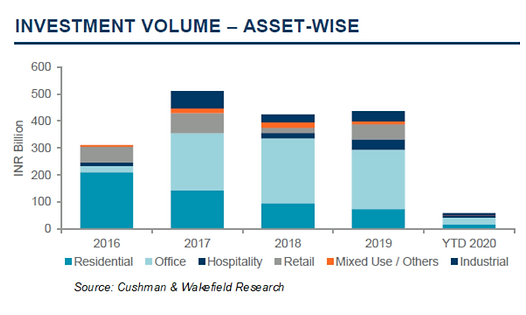
Chart 8: Private Equity Investments in Real Estate - sharp fall
Source:
Commercial including IT / ITES - Reassessing Strategies
Work from home savings are real - all the office space occupied is not needed anymore. By reducing space, costs including transport, can be reduced by as much as 15 - 20% and if even part of that gets re-spent on providing software upgradation, IT broadband and house allowance to an employee working from home, there are still savings. Of the country's 575 million square feet Grade A office stock, about 80% is used for software coding and voice and 20% for serious thinking - even if 5% of that 80% portion gets reduced (5% x 0.8 x 575) that's 23 million square feet that can get reduced and can come up for re-renting.
Big tenants are also driving hard to lower the rents or relocate to smaller spaces. Smaller corporates/ Small proprietary firms have seen many opting to vacate and move to completely work from home or take up space in co-sharing locations. Many start-ups have given up space as rentals act as one of the biggest cost components of tech-service firms.
At the same time, the office, the water-cooler talks are not going to go away. Over the next year, many will work out a hybrid model of office space and work-from-home.
The sharp rebound in the equity markets since the bottom in March 2020 remains surprising to many. It isn't an Indian phenomenon; there is a global rebound in stock markets. India's equity market euphoria though is particularly challenging on two moot points:
1. India has had amongst the strictest lockdown and COVID-19 cases yet remain on the rise
2. India's fiscal response when measured in terms of cash outgo has been the lowest
The (-)23% GDP fall for the quarter ended June 2020 is not the issue. The larger worry is the ~(-)10% GDP fall estimated for the full year 2020-2021. The last 3 years of slowdown, the fall in incomes, the increase in unemployment and now the economic impact of COVID - not ideal signs of equity market performance.
Chart 9: No Earnings, but P/E expansion
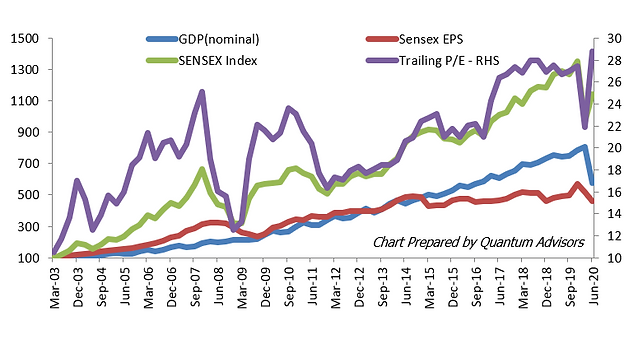
Line chart showing that the Sensex index has risen largely due to P/E multiple expansion rather than earnings growth, with GDP and EPS growing steadily while trailing P/E increases significantly over time.
Source: Bloomberg Finance L.P, EPS, Index and GDP rebased to 100 - Mar 2003; Data till June 2020
As seen from Chart above, in the last five years, only P/E expansion has led to rise in Sensex. The earnings line is a flatline even below nominal GDP. Many have opined on this and below are our viewpoints on the same
- Companies listed and part of the BSE-500 form the better part of the economy and thus have stronger balance sheets to gain market share from the unlisted/unorganized segments.
- Investors are pouring in money into these companies based on this formalization trend as evidenced by increasing flows into MFs and the rising P/E ratios of these companies.
- Within the Sensex and the BSE-500 there is similar polarization and a few stronger and larger companies have a large impact on index performance.
- Companies are more linked to the global demand and supply cycle.
- The global rate cuts and liquidity easing benefit these larger companies.
Quantum's Value Equity strategy newsletter details this macro and market conundrum of lower growth, lower earnings and high market index levels. However, the strategy cash level of 11%, a shade below its long term average does indicate that there is value outside the index and despite the index valuation reflecting near peak
- In the very near term, with uncertain zero earnings visibility, equities are likely to be driven by A) success or failure of outcomes of policies dictated by a government that is still not coming to grips with the economy's real problems, and B) fears of disruption caused by the virus. If the market is disappointed, we believe a 20% correction in USD terms is possible as the PE for the SENSEX has almost gone back to its highs.
- The long-only, bottom-up value portfolio we have nurtured is trading at a substantial 53% discount to the historical PER valuation of the Index. For now, our work indicates a 44% Upside Potential over 2 years. We suggest neutral weight.
Table 2: Quantum Value Equity Summary View - Neutral allocation after market rebound
| Indicator | Our Reading of the Indicators | Our View on expected outcome / possible course of action |
|---|---|---|
| Valuations | Elevated | Cautious on the Index – opportunities elsewhere |
| Flows | Locals holding on but showing first signs of nervousness | Local nervousness may remove cushion from any foreign selling |
| Economic Activity | Slow pick up | Recovery weak without government spend |
| Earnings | Not much visibility | Sell-side will downgrade March 2021 estimates |
| Upside Potential estimate of the Strategy | 44% over the next years | Higher than our 14-year average of 36%. |
| Downside risk estimate of the market/portfolio | Limited downside given portfolio valuations; however, markets tend to overshoot/undershoot in both directions on account of sentiments and flows | Foreign selling could trigger a slide but local buying may support; FX risk |
| Suggested Allocation | July 2020: 75% to 100% of what you wish your long-term exposure to be; Neutral changed from the earlier recommendation of March 2020: 100% to 125%; Over-weight | Invest for the long-term upside, and be ready to add more when markets decline |
Source: Quantum Advisors, as on end September 2020
For more information and if you wish to discuss the details in the newsletter or if you wish to know more about our investment strategies, the investment philosophy and investment opportunities, please contact:
Arvind Chari - [email protected]
Arvind Chari - Head of Fixed Income and Alternative Investments at Quantum Advisors. Arvind's vast experience in managing money for global investors and his interactions with leading institutions has exposed him to a world of knowledge. With over 21 years of experience in tracking domestic and global economy he is Quantum's thought leader and is the author of this Q-India Insight edition.
*While we shall comply with all applicable regulations and it is our endeavor to follow industry best practices for the benefit of all our clients, non-US persons and investors in our non-US funds should take note that registration of QAPL as an investment adviser with SEC does not imply any level of skill or training. that our non-US clients are entitled to the full benefit of all substantive provisions of the Investment Advisers Act 1940 (Advisers Act) or that we are required to comply with all the provisions of the Advisers Act in our dealings with our non-US clients, including non-US funds. We will thus have responsibilities under the Advisers Act that differ from client to client, based on whether or not the client is a non-US client".
This article is strictly for information purposes only and should not be considered as an offer to sell, or solicitation of an offer to buy interests in the account. Investments in the equity and fixed income instruments are not guaranteed or insured and are subject to investments risks, including the possible loss of the principal amount invested. The value of the securities and the income from them may fall as well as rise. Past performance does not guarantee future results and future performance may be lower or higher than the data quoted, including the possibility of the loss. Quantum Advisors reserves the right to make the changes and corrections to its opinions expressed in the document at any time, without notice. Information sourced from third parties cannot be guaranteed or was not independently verified. Comments made herein are not necessarily indicative of future or likely performance of the account and are based on information and developments as at 31/08/2020 unless otherwise stated.
All of the forward-looking statements made in this communication are inherently uncertain and Quantum Advisors (QAPL) cannot assure the reader that the results or developments anticipated by QAPL will be realized or even if realized, will have the expected consequences to or effects on, us or our business prospects, financial condition or results of operations. A prospective investor can generally identify forward-looking statements as statements containing the words "will," "should", "can", "may", "believe," "expect," "anticipate," "intend," "contemplate," "estimate," "assume", "target", "targeted" or other similar expressions. Readers are cautioned not to place undue reliance on these forward-looking statements in making any investment decision. Forward-looking statements made in this communication apply only as of the date of this communication. While we may elect to update forward-looking statements from time to time, we specifically disclaim any obligation to do so, even if internal estimates change, unless otherwise required by applicable Securities law


Is India a Flailing State?
The contradiction of a fast growing democracy with a failure to provide support during the recent surge has implications on the economy.
Our Strategies
Explore how our two main strategies – Predictable India Equity and India Integrity Equity - with demonstrated success of our tried and tested research and investment processes can ensure your India equity allocation will have higher predictable outcomes and no surprises.
Q India Value Equity Strategy
20+ years of India Long-only, Liquid, High-Governance, Margin of safety = Predictability
Integrity screen since 1996, strategy Track record since 2000.
Q India Responsible Returns Strategy
Liquid, proprietary Integrity Scores, Financial Soundness
Integrity Screen since 1996, enhanced criterion since 2015, strategy Track Record since 2019; strategy AuM: $9.7 mn Mandate Capacity: $5 billion
Quantum Advisors pioneered a quantitative as well as qualitative analytical approach to equity investing in India, providing for the first time, consistently applied valuation metrics to evaluate investment opportunities in India’s emerging stock markets. Over the years, Quantum Advisors has continued and enhanced its tradition of extensive financial analysis and value investing, as it has evolved into an investment advisor and asset manager.
Our investment philosophy and strategy involves the use of intensive qualitative and quantitative fundamental analysis. We build and monitor our clients’ portfolios actively while at the same time avoiding excessive trading, and control risk by endeavoring to keep our clients’ portfolio adequately diversified, both in terms of the sectors included in those portfolios, as well as with respect to the level of concentration in any specific security.