


Quantum Advisors India
Building your India portfolio since 1990 on a foundation of ethics, integrity & disciplined investment research process.
The relevance of GDP growth as the one key measure of a country’s development has long been challenged. The threats from climate change and the social impact from COVID should make it clear that a single-minded quest to target GDP growth can no longer be any nation’s priority.
We do know from the way the GDP statistic is computed that it leaves out a lot of activities which actually matter to the daily lives of its citizens – for e.g - clean air, quality of health and education, income and social justice.
Technological changes and innovation have also brought about massive changes in the different factors of production and consumption. Today’s GDP calculation may not reflect the underlying economic activity. Economists and policy makers have for years asked for alternate measures to gauge growth and development, however in the absence of any other simple and easy to understand and globally comparable statistic, the GDP data remains the measure of choice.
In India, we have faced a different issue. Ever since the GDP series was re-based to 2011-12 and changes were made in the methodology for value added and deflators, the GDP data and the other usual macro indicators have been at odds. Arvind Subramaniam, the ex- Chief Economic Advisor to the finance ministry, in a brilliant paper
At Quantum, puzzled by the high GDP readings post demonetisation and GST as compared to other macro indicators which remained weak, we began using a naïve approach to estimate actual real GDP at 1.0%-1.5% below the reported data.
We began indicating to our internal teams and to external investors that the Indian real GDP number is over-estimated and is no longer a relevant measure to gauge economic activity and that we should focus on other real-time measures of macro indicators and corporate activity.
By 2019, the multi-year slowdown in household and corporate investment activity, the bad and unresolved state of the banking and financial system, the fall in Indian exports and the destruction of income and employment in the informal economy, got us to question our long held long-term real GDP growth estimate of 6.0%-6.5%.
The government’s feeble initial response with the ‘Atma-Nirbhar Bharat’ (self-reliant India) package post the harsh COVID related lockdown in early 2020 further convinced us that the scarred India economy would take a long-time to get back to its long-term potential.
The recovery since has been much better than expected and has raised hopes. However, will India get back to a higher growth trajectory? India needs sustained long-term growth to pull people out of poverty, create jobs for the young and to boost incomes to widen the consumption base. That growth, as the table below shows, then reflects in the long-term return potential in the India asset markets.
Table 1: GDP Growth drives long-term market returns
| Indian Equity: Our Expectations of Annual Long‑term Returns in US$ | Return |
|---|---|
| GDP, real | +6.5% |
| + Inflation | +5.0% |
| = GDP, nominal | +11.5% |
| If GDP = Revenues (Revenues of Typical Companies) | +11.5% |
| Profit Growth of Typical Companies | +11.5% |
| Companies, listed and in an Index > Typical Company | +13.5% |
| An Intelligent Portfolio | +15.0% |
| FX, INR 70 – 75 | −2% |
Disclaimer: The figures mentioned in the above table are based on the assumptions and estimates made by Quantum Advisors. “An intelligent portfolio” mentioned above refers to a portfolio constructed by an investment manager following an active approach to investing with an appropriate research and investment process in selecting stocks. These growth rates or indicative rates of return may or may not be achieved.
Can India grow at 7%?
The answer to this proverbial question on India’s potential growth rate depends on the period in which the question was asked:
- If asked in the 1980s - the hopeful answer would have been 5%
- In the 90s, post liberalization, hopes had risen for a sustainable 6% growth rate
- In the ‘Goldman Sachs - BRIC’ mania of 2004-2011, it was India’s birth right to
grow at 9%
- Morgan Stanley’s ‘Fragile Five’ in 2013 smothered it down below 8%
- ‘Ache Din’ in 2014 raised hopes of 8% again
- In ‘Atma-Nirbharta’, many seem to be settling for 6%.
Chart 1: India’s growth peaked in 2011 and has been on a slide ever since
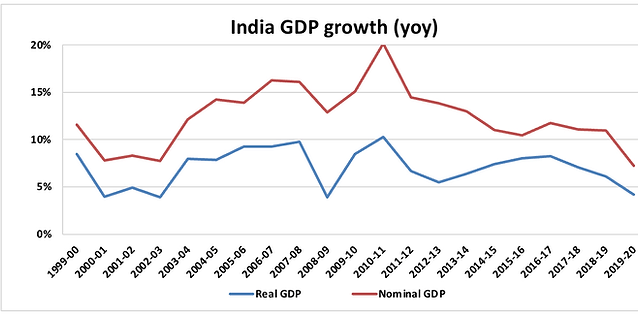
Source: MOSPI, CMIE, Annual Data till March 2020
Chart 2: Business sentiment rising, consumer sentiments have a long way to go
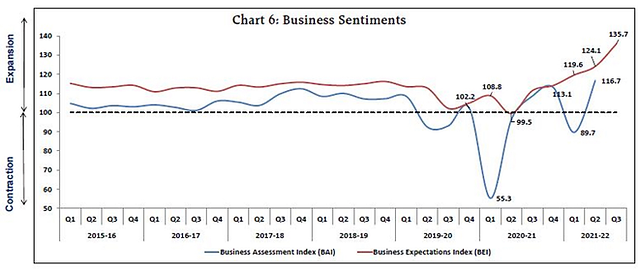
Line chart showing business sentiment from 2015–16 to 2021–22, with both business assessment and expectations mostly above the neutral 100 level, dipping sharply during 2020–21 and then recovering strongly by 2021–22.
Source: RBI, CMIE Consumer Sentiment data till October 2021
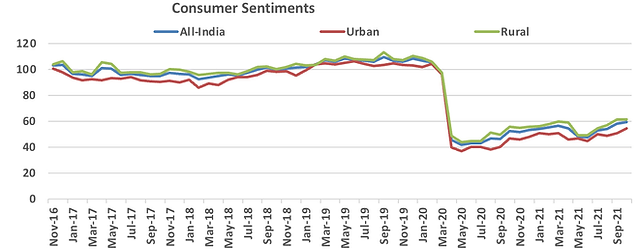
Line chart showing consumer sentiment trends for all‑India, urban, and rural areas from Nov 2016 to Sep 2021.
Source: RBI, CMIE Consumer Sentiment data till October 2021
The recovery in economic activity including in the GDP data has been much better than expected. However, below we want to look at some long term macro trends to see if this gives us enough confidence to put India on a sustained growth path.
1. Modi sheds his fiscal conservatismIn an earlier Q India insight piece, ‘A Rating for Growth’ , we had opined that India’s investment grade rating is a rating for India’s growth potential. Despite the high debt to GDP ratios, the rating agencies expect India’s growth to solve its macro challenges. It was thus good to see India using its fiscal levers to get back growth and spending. This was one of the big reasons for us to feel comfortable about India getting back to its 6.0%-6.5% long-term growth potential.
The government announced in its 2021 budget to not only keep the fiscal deficit wide this year but that the Centre’s Fiscal deficit will be 4.5% of GDP till Fiscal year 2026. As per a legal mandate, India was supposed to limit fiscal deficit to 3% of GDP. This was always unreasonable and exacted rather large demands of the government from fulfilling its social obligations. This increase in fiscal deficit allows a cumulative spending of approximately ~USD 1 trillion (~30% of current GDP) in the coming 4 years for the centre alone. If used to spruce up spending on infrastructure and improving the quality of health and education, it can boost long-term GDP.
Chart 3: Government capex spending to rise in the next 5 years
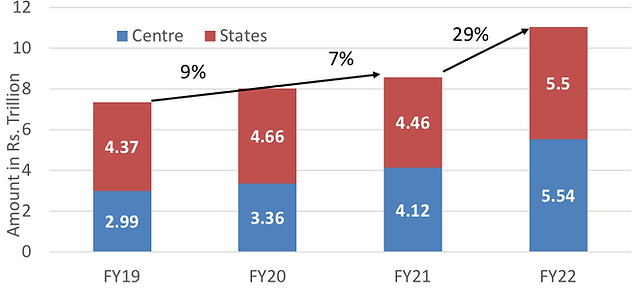
Source: indiabudget.gov.in, CMIE
The recent change in rating outlook from negative to stable by Moodys is a testament to the fact the India’s financial system is stabilising and nominal growth has the potential to rise to meet the macro challenges of high debt and deficits.
2) The Twin-Balance Sheet problem seems to be resolving itself
This issue has plagued India since the collapse of the investment cycle in 2012. India Inc went over-board in believing in the 9% growth story and the over-investment along with policy paralysis, scams and the deterioration in macro led to high debt with low capacity utilisation. The impact of that was equally seen in the Indian banking sector balance sheets.
Chart 4 and 5: Improving corporate and bank balance sheets
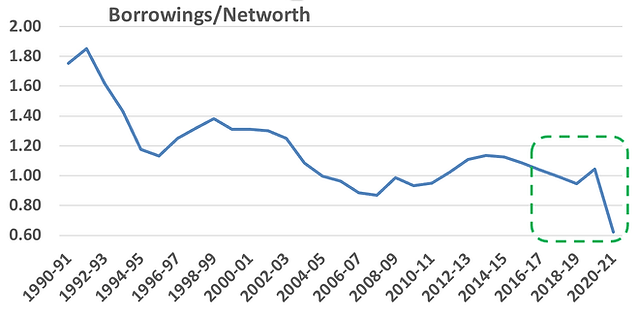
Line chart showing borrowings to net worth ratio of India from 1990-2020-21.
Source: CMIE Economic Outlook; ratio calculated for non-financial corporate aggregate data, Banking NPAs % - RBI; Annual Data
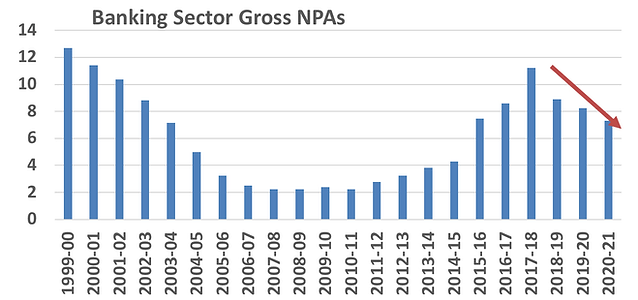
Bar chart showing banking sector gross NPAs from 1999-00 to 2020-21.
Source: CMIE Economic Outlook; ratio calculated for non-financial corporate aggregate data, Banking NPAs % - RBI; Annual Data
As the chart suggests, India Inc has been on a deleveraging cycle. The corporate tax cut announced in September 2019, (approx. INR 1.5 trillion) seems to have been almost entirely used by corporates to repay their debts. In the absence of fresh capex and with the low prevailing interest rates, we now know that especially the listed corporates are seeing a rise in cash profits and net profit margins. Earnings estimates of listed Indian corporates has seen a large increase in the last year.
Banks have also seen a reduction in overall gross NPAs (although we would caveat it by saying that the actual COVID impact due to moratorium and government guarantees masks the number). The government capital infusion, banks raising fresh capital from the markets, the increased profitability from treasury gains (fall in interest rates) and lower provisions has also meant that bank’s capital adequacy ratios are well above the required threshold and general risk appetite in bank is better than the pre-covid period.
Thus, India Inc. is in a position for a debt funded investment cycle and Banks are well prepared to fund that.
3) High Liquidity in the banking system and low interest rates bodes well for a rise in credit growth
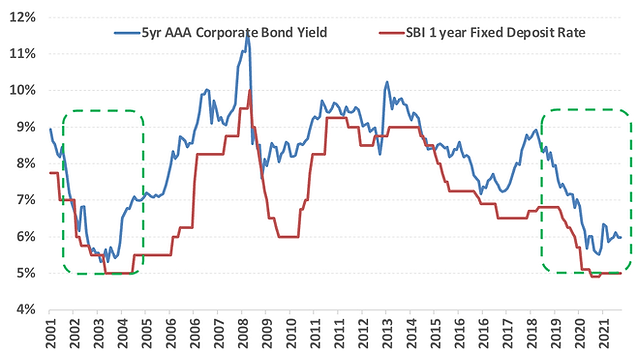
Indian Banks today own more than 10% in excess government bonds. In absolute terms, they can sell government bonds worth more than INR 15 trillion without raising new equity or depending on the RBI for funding and lend that money. The flip side to that is the chart on the right, where the unprecedented credit growth in the 2003-2008 period led to an increase in bond yields as banks sold low yielding government bonds to fund credit.
We are not in such a growth situation now to worry about the extent of rise in bond yields. Bond yields will rise as the RBI normalises its monetary policy and the RBI would likely manage the extent and the pace of yield increases.
Even then, every credit creates its own deposit demand. Also, in a growth environment, every financial balance sheet grows which creates its demand for government bonds. Finally, if India is included in the emerging and global bond index, some amount of the excess SLR and government fiscal deficit supply pressure will be absorbed by the foreign buying.
Chart 6 and 7: High Liquidity and Low interest rates bode well for credit growth
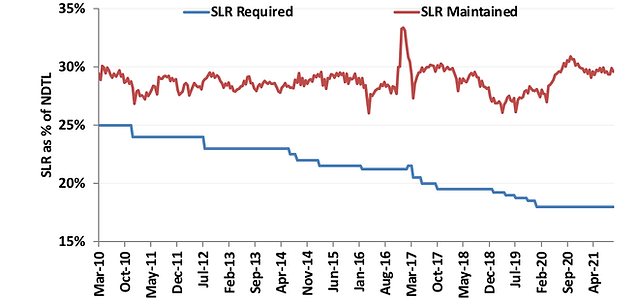
Line chart comparing SLR required and SLR maintained from March 2010 to April 2021.
Source: RBI, Bloomberg Finance L.P; SLR Data – Annual till March 2021; Chart 7: Data till October 2021
Source: RBI, Bloomberg Finance L.P; SLR Data – Annual till March 2021; Chart 7: Data till October 2021
4) Global recovery drives Indian exports – Exports is the first driver of capex
The global fiscal and monetary stimulus of ~USD 20 trillion since the start of the pandemic has led to the recovery being way better than expected. The rise in global commodity prices is reflective of a demand led recovery which was accentuated by a supply crunch due to COVID restrictions. Global manufacturing PMIs have been steadily on the uptrend, indicative of the sustained economic recovery from the depths of early 2020.
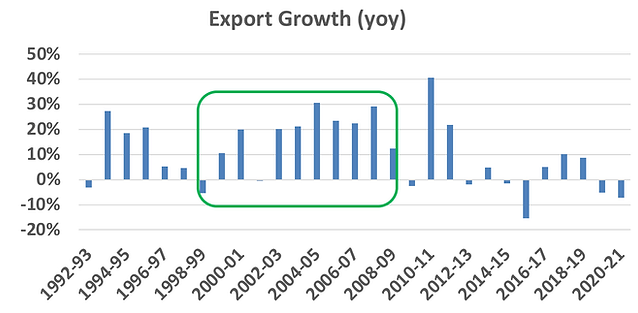
Chart 8 and 9: Global PMIs rise, Will the Export boom drive investments?
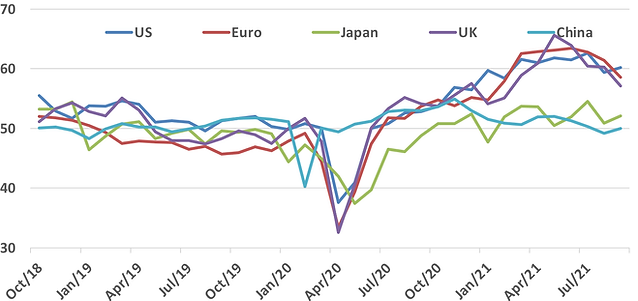
Source: CMIE, Bloomberg Finance L.P; PMI data till October 2021; Export Data Annual till March 2021
Source: CMIE, Bloomberg Finance L.P; PMI data till October 2021; Export Data Annual till March 2021
This global demand for goods has meant that Indian exports have finally begun to increase after a 10 year lull. Exports of goods is running at an annual pace of USD 350 billion as compared to USD 280 billion in 2019.
Given the weak domestic demand, exports growth is one of the most important drivers of the economic recovery. In the 2003 growth period, it was exports which was a big driver of domestic growth and set forth the credit growth and the domestic investments.
Even if global growth slows down, we would expect India’s export growth story to continue. There are two underlying themes which we think can support domestic production and export.
One is the ‘China Plus One’ theme, as global MNCs look for manufacturing and supply chain outside of China. India has done a poor job up until now in attracting those business. However, 2/3 sectors have benefitted from the shift in supply chain – chemicals and pharmaceuticals and electronic goods. The other is India’s Production Linked Incentive (PLI) to further ‘Make in India’ and get into the global supply chain.
Chart 10 and 11: Will India be able to plug in to the global manufacturing supply chain?
Manufacturing Exports rises in share
| Category | 2000–01 | 2005–06 | 2010–11 | 2015–16 | 2019–20 | 2020–21 |
|---|---|---|---|---|---|---|
| Petroleum products | 4% | 11% | 17% | 12% | 13% | 9% |
| Agricultural & allied products | 14% | 10% | 10% | 12% | 11% | 14% |
| Ores & minerals | 3% | 6% | 3% | 1% | 1% | 2% |
| Manufactured goods | 78% | 70% | 63% | 74% | 73% | 74% |
| Chemicals & related products | 10% | 10% | 9% | 12% | 15% | 17% |
| Engineering goods | 13% | 19% | 20% | 22% | 24% | 25% |
| Electronic goods | 2% | 2% | 3% | 3% | 4% | 4% |
| Textiles (ex‑readymade garments) | 13% | 8% | 5% | 6% | 5% | 5% |
| Other commodities | 2% | 2% | 7% | 2% | 1% | 1% |
PLI scheme to frontload Capex
| Sector | PLI Outlay USD Bn |
|---|---|
| Mobile Phone | 5.5 |
| Advanced Chemical Cell Battery | 2.4 |
| Pharma | 2.0 |
| Telecom, Networking and IT hardware | 2.6 |
| Food Products | 1.5 |
| White Goods | 0.8 |
| Solar PV Modules | 0.6 |
| Medical Devices | 0.5 |
| Auto and Auto Components | 3.5 |
| Textile and specialty steel | 2.2 |
| Total PLI outlay from the government | USD 21.6 billion |
(Source: CMIE; MEITY ; Exports table is % share of total exports); PLI – Production Linked Incentive Scheme, Data as at June 2021)
Our back of the envelope calculation suggests that PLI can drive total cumulative turnover of ~USD 400 bn over the next 5 years and a front-loaded capex of ~ USD 30 billion. Although PLI is being seen as an import substitution incentive, we would expect a decent share of PLI to be geared for exports, especially by MNCs.
5) Residential Housing turning around
The other large piece of the puzzle which drives significant capex is house building. Decade low interest rates, better affordability, lower or stagnant prices is finally conjuring together to ease the burden of the real estate companies. Given the stress on real estate since demonetisation and exacerbated by the credit crisis, new house building stock was severely restricted. Inventory levels, as per industry data, has now fallen across Tier-1 and even in Tier-2 towns.
Real estate as we know has among the highest multipliers in the economy. From land sales to the planning and designing, construction and house furnishings and the other side of financing and taxes, it generates value across the economic value chain.
When we see this activity moving from urban to towns and rural areas is when the economic impact is broad-based. See chart below, and you will notice that India’s investment to GDP fell but it was equally led if not more by households reducing house buying/building activity.
Chart 12 and 13: Residential activity picks up; should aid investment led growth
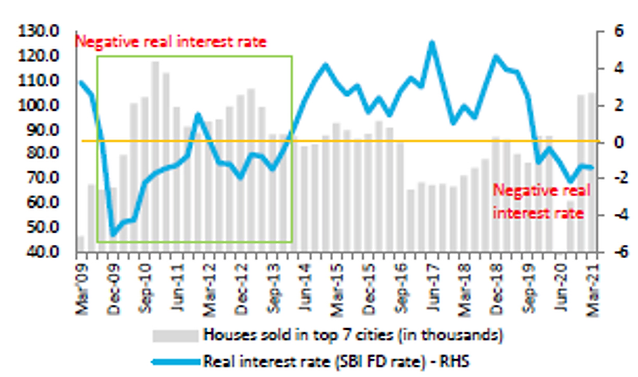
Chart comparing home sales in India’s top seven cities with real interest rates from 2009 to 2021, highlighting periods of negative real interest rates and shifting housing sales trends over time
Source: Spark Capital Research, CMIE – Investment data is Annual till March 2020
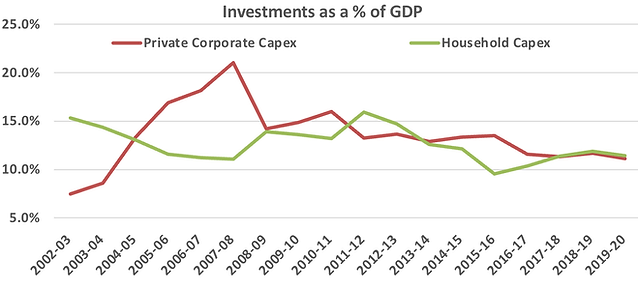
Source: Spark Capital Research, CMIE – Investment data is Annual till March 2020
6) Long-Term Capital available
There is no dearth of capital. India has received increasing amounts of flows from FDI, portfolio and over the last 5 years into Real Estate, Private Equity and venture Capital. In fact, as we have shown, India is yet under-invested by global corporations and by global portfolio investors .
Chart 13 and 14: India has seen large flows; and has the absorptive capacity
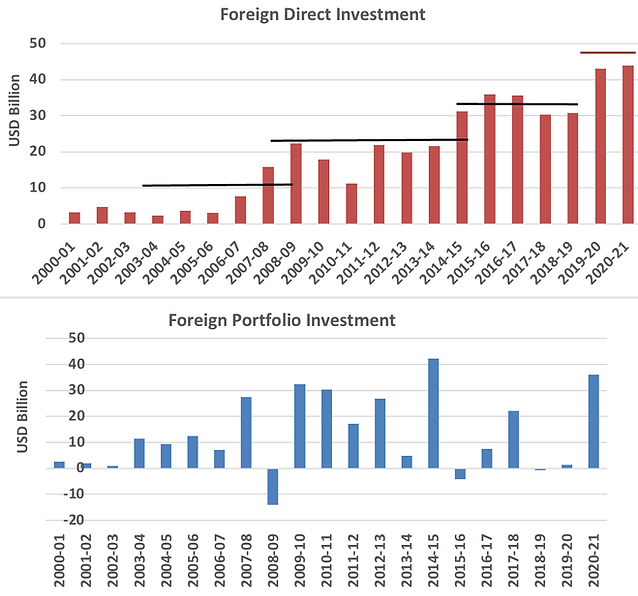
Source: CMIE, RBI; Annual Data till March 2021
Good corporate balance sheets and improving bank balance sheets, low interest rates and high liquidity, improving global demand boosting exports, a recovery in residential housing and availability of global capital bodes well for a sustained GDP growth recovery
There are risks from oil prices and inflation and from the loss of income effects pulling down growth. However, India has managed to grow with inflation and high interest rates in the past. The income effect deleterious as they have been pre and post pandemic should improve as growth recovers and jobs get created. If the government would have used some of its extra tax revenues to provide some income support, it would have helped cement this recovery from the demand side.
We expect all the above should boost near term growth to above our long-held 6.0%-6.5% real GDP growth. However, we would need to see some actual signs of ground level private corporate capex to pick up and focussed government spending on infrastructure.
In our, what drives growth piece, we wrote about how sustained investments growth is required for India to grow in high single digits. All the Asian miracles, Japan in the 70s, Korea in the 80/90s and China in the 90s/00s all had double digit investments growth for at least a decade if not more.
India has not been able to achieve sustained investments and hence our potential growth has remained in the 6.0%-6.5%. Sustained investment growth requires other policy reforms, ease of doing business, macro stability and political consensus.
This is one reason why at Quantum we have continued to retain our expectations on long term sustainable growth at around the 6.0%-6.5% range. Be it the Congress or the BJP governments, we are yet to see blue-prints to necessitate long term sustained growth. India keeps making incremental reform changes which will drive short term incremental growth.
This government has made some important changes in ease of living – sanitation, electricity, cooking gas, digited and mobile identity. It has also enacted policy reforms – liberalised FDI, Bankruptcy Act, GST, signed up to Inflation targeting, moving towards privatisation and monetisation of assets.
However, the non-enactment of the new labour code and the recent repeal of the farm sector laws (in what we believed were good reforms for long term productivity increases in the farm sector), holds a key lesson. In the Indian democratic system policy reforms require consensus. It does not matter that the ruling party has a strong mandate in the parliament to pass laws. It needs to build consensus on tricky issues across party lines to get real change.
India is not China. However, as the saying goes, India will continue disappoint both the pessimists and the optimists.
Annexure A: India’s reforms and growth over the last 40 years

For more information and if you wish to discuss the details in the article or if you wish to know more about our investment strategies, the investment philosophy and investment opportunities, please contact:
Arvind Chari – [email protected]
Arvind Chari is the Chief Investment Officer (CIO) at Quantum Advisors. Arvind’s vast experience in managing money for global investors and his interactions with leading institutions has exposed him to a world of knowledge. With over 21 years of experience in tracking domestic and global economy he is Quantum’s thought leader and is the author of this Q-India Insight edition.


Our History
Quantum Advisors was founded by Ajit Dayal as India’s first institutional equity research house in January 1990.
Our Strategies
Explore how our two main strategies – Predictable India Equity and India Integrity Equity - with demonstrated success of our tried and tested research and investment processes can ensure your India equity allocation will have higher predictable outcomes and no surprises.
Q India Value Equity Strategy
20+ years of India Long-only, Liquid, High-Governance, Margin of safety = Predictability
Integrity screen since 1996, strategy Track record since 2000.
Q India Responsible Returns Strategy
Liquid, proprietary Integrity Scores, Financial Soundness
Integrity Screen since 1996, enhanced criterion since 2015, strategy Track Record since 2019; strategy AuM: $9.7 mn Mandate Capacity: $5 billion
Quantum Advisors pioneered a quantitative as well as qualitative analytical approach to equity investing in India, providing for the first time, consistently applied valuation metrics to evaluate investment opportunities in India’s emerging stock markets. Over the years, Quantum Advisors has continued and enhanced its tradition of extensive financial analysis and value investing, as it has evolved into an investment advisor and asset manager.
Our investment philosophy and strategy involves the use of intensive qualitative and quantitative fundamental analysis. We build and monitor our clients’ portfolios actively while at the same time avoiding excessive trading, and control risk by endeavoring to keep our clients’ portfolio adequately diversified, both in terms of the sectors included in those portfolios, as well as with respect to the level of concentration in any specific security.