


Quantum Advisors India
Building your India portfolio since 1990 on a foundation of ethics, integrity & disciplined investment research process.
The total market capitalization of the Bombay Stock Exchange (BSE) crossed USD 3 trillion for the first time in May 2021. It had crossed USD 1 trillion in market capitalization in May 2007 and USD 2 trillion in July 2017.
The market capitalization denotes the total value of all the shares outstanding. So, it is used as a measure of wealth. We are used to seeing media reports stating investors wealth rose or fell as markets gyrate. This is of course done by comparing the change in market capitalization of an index or of the whole market itself.
The BSE is India’s oldest stock exchange and has more than 4,000 companies listed, of which on an average more than 3,000 trade daily. India’s other exchange National Stock Exchange (NSE) which commenced operations in 1994 has about ~1,900 companies listed.
Indian cash public equity markets trade on an average ~USD 9 billon per day. 90% of that trading happens on the NSE. India’s derivatives markets (futures and options) as expected are much more liquid. The NSE is the world’s largest exchange in Derivatives ahead of the Chicago Mercantile Exchange (CME) and is the fourth largest in the world in cash equities. India’s key primary equity indices, the BSE-30 Sensex Index and the NSE-50 Nifty Index rank in the Top-10 in the global market capitalization ranking.
India’s capital markets have been one of the biggest beneficiaries of the economic reforms of 1991. It has developed well over the past three decades under the continued reform and prudent regulation of the Securities and Exchange Board of India (SEBI).
Image 1: India scales USD 3 trillion in Equity Market capitalization
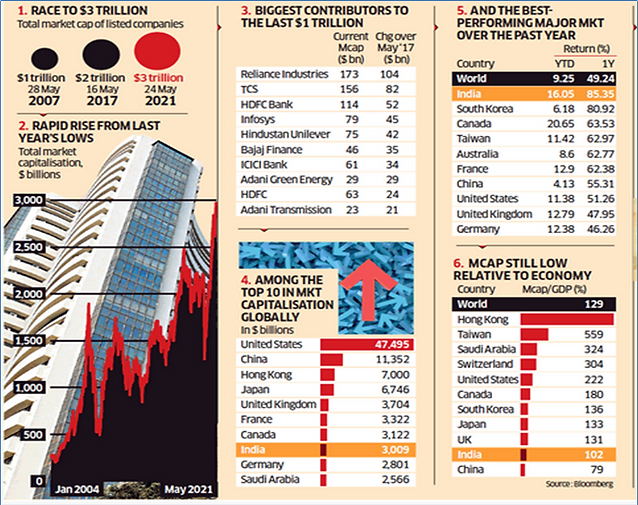
Source: Business Standard infographic, May 2021
Despite the absolute size and scale of the Indian public equity markets, certain aspects of the depth of the Indian markets remains shallow. For Instance;
Although more than 4,000 companies are listed,
- ~90% of the institutional investments by FPIs and MFs are in Top-100 companies
- As of June 2021, 375 companies had market capitalisation of over USD 1 billion
- As of June 2021, ~600 companies had average daily trading volume of >USD 1 million
For a population of over 1.3 billion,
- India has only ~69 million demat (securities holding) accounts
- India has only ~22 million unique mutual fund investors
Indian founders or promoters, (private, foreign and government) continue to own on average ~50% of the total market capitalisation. Foreign portfolio investors who were first allowed to invest in India in 1991-92 now own ~ 25% of the Indian stock markets. Adjusted for promoter holding, foreigners own ~50% of the free-float market capitalisation.
Table 1: India’s free-float needs to rise to allow larger institutional and retail ownership
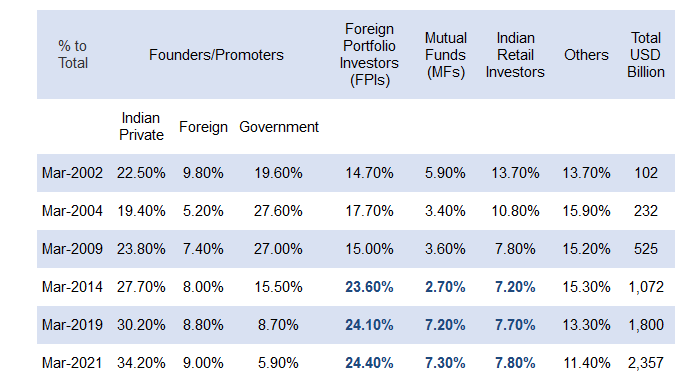
Source: Ownership Data for the BSE-200 Index, Kotak Equity Research, Morgan Stanley Research
India’s market capitalisation will of course increase over the years. However, we are more interested in the depth of that Indian market capitalisation. More than just an increase in share prices of the entities, we would want to see it driven by the following reasons:
1. Increased participation by a) foreign institutional and b) domestic retail investors as promoter holdings are reduced either by regulations or through market action.
2. New age companies backed by individuals, corporations and private equity/venture funds getting listed and thus broad-basing the investment universe for investors.
Global and Domestic Investors will significantly increase their investment to Indian Equities
Table 2: Global Investors are grossly under-invested in Indian capital markets.
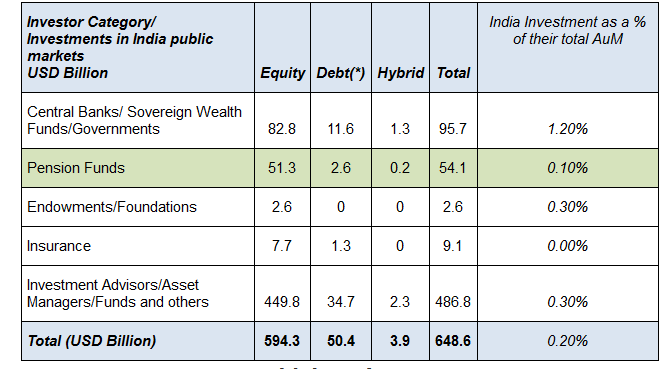
Source: NSDL Data, June 2021; Global AuM data: PWC, OCED, TowersWatson; Quantum Analysis and Assumptions
Total global investable assets under management of institutions, wealthy individuals are estimated to be ~USD 270 trillion. The market value of investments in Indian Equity, Fixed Income, Private Equity, Real Estate and Infrastructure is estimated to be about ~USD 1 trillion. India’s allocation in a global portfolio is less than 0.5%.
As India’s economy matures, we have argued that foreigners need to make dedicated allocation to India . India’s weight in global portfolios will increase. If foreign investors increase their India portfolio weightage by 1% over time; India stands to get an incremental USD 2.7 trillion.If Indian Public Equity commands 60% of that incremental allocation, that’s another USD 1 trillion of foreign buying of Indian shares. That in itself is ~30% of the current overall market capitalisation.
Add to this, the latent buying power of the Indian domestic investor
Chart 1: Foreigners and domestic Indian investors are under-allocated to Indian Equities
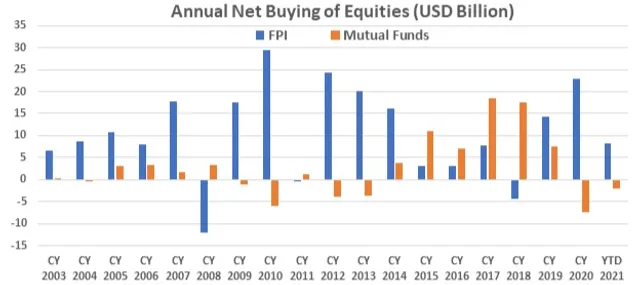
Source: NSDL Data, SEBI, YTD = June 2021
The chart above of Equity investments by mutual funds is reflective of the trend over the last 5 years of an increase in inflows to equity mutual funds predominantly from individual investors. The systematic Investment Plan (SIP) inflows into Equity funds remains above the USD 1 billion mark per month. Indian Mutual Fund has ~USD 460 billion in total assets under management, of which Equity investments was ~USD 175 billion.
As compared to global markets Indian mutual fund and equity investing has a long way to go.
Mr and Ms India are just about warming up to the India growth and investment story. As we listed earlier with the data on the number of demat and mutual fund investors, an average Indian does not even invest in equities and mutual funds.
Of those who do have disposable income and savings, the average Indian has cumulatively invested more than 45% of their savings in Bank Deposits and government saving schemes, more than 30% in Insurance and Provident Funds and only ~5% in Equities and Mutual Funds.
As the income and savings of the average India rises along with financial awareness, we should expect higher investments in direct equities and/or equity mutual funds.
This kind of a probable investing flow requires a substantial increase in the investable universe.
Private Equity (PE) and Venture Capital Funds (VC) investee companies will get listed in the public markets
India has received more foreign inflows into private equity/venture capital than in listed public equities. The PE/VC line on the left includes real estate and infrastructure investments as well. The private and alternative investing space of course is larger but is beset with problems of liquidity, governance, and access.
Chart 2 and 3: India’s public markets will see increased IPOs as PE/VC look for exits
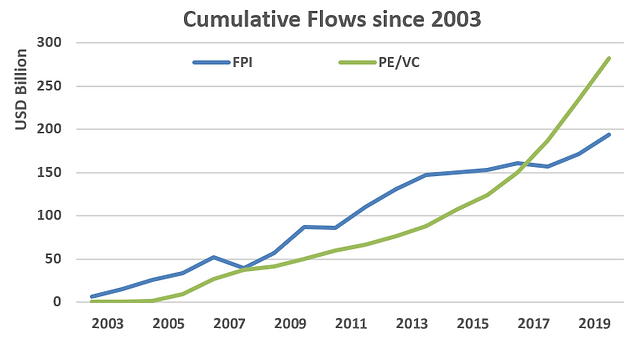
Source: NSDL, EY report on India Private Equity and Venture Capital Industry: some PE investments may have also been counted in FPI
Despite that as the data shows, money has poured into Indian Private business and the start up ecosystem. The recent success of Zomato, a start-up which became a Unicorn (USD 1 billion in Valuation) in 2018 and got a listing valuation of ~USD 8 billion, is a sign of things to come.
Venture intelligence reports that India already has 53 unicorns, 17 of which got that exalted status in CY 2021 till July. Many of the erstwhile start-ups have scaled up and seem ready for public listing in the years to come. The likes of Flipkart, PayTM, Byjus, Ola, Oyo who have all stated intentions of a public listing, already command valuations of USD 5 billion and above.
Investment bankers, with their itchy hands, have claimed that these internet unicorns of now and in future by themselves would create an investable universe worth USD 300-400 billion in market capitalization.
Of course, it is not just the internet and start-up economy. Over the last few years, we have seen large public listings of companies from the insurance (life and general), asset management, banking, financial services and intermediaries, retail, consumer sectors, REITs, infrastructure.
As the economy matures and expands, many more such diverse businesses will seek to be listed in the Indian public equity markets expanding the investable universe.
The regulator, SEBI would do well in ensuring that companies meet their minimum public float and over-time increase the non-promoter shareholding to improve India’s public equity investable depth, liquidity, governance and capacity.
Foreign Institutional Investors and Domestic Retail Investors need to re-look at their existing allocation and think of allocating to Indian equities and in that, public equities as a large, dedicated allocation.
As we have mentioned many times, Indian public equities deliver significant out-performance over the long-time frame.
Chart 4: Investors are missing out on India’s long-term returns due to under-allocation
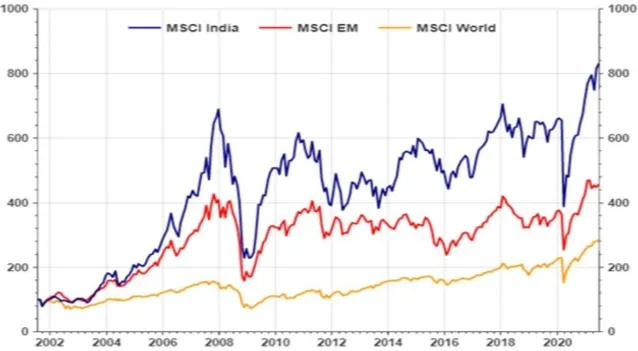
Source: Refinitiv Datastream. Returns in USD, Data for a 20 year period ending 30-June-2021
Appendix A: India’s Long-Term Economic Growth is reflected in India’s Stock Market Performance
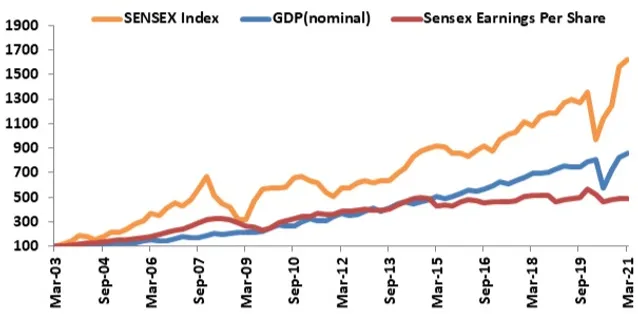
Source: Rebased to 100 = Mar 2003, Quarterly Data till Mar 2021, Bloomberg Finance L.P, CMIE
Appendix B: India’s Long-Term Economic Growth allows a simple Public Equity market return assumption

Source: Quantum Analysis and Estimates; The figures mentioned in the above table are based on the assumptions and estimates made by Quantum Advisors. “An intelligent portfolio” mentioned above refers to a portfolio constructed by an investment manager following an active approach to investing with an appropriate research and investment process in selecting stocks. These growth rates or indicative rates of return may or may not be achieved.
For more information and if you wish to discuss the details in the article or if you wish to know more about our investment strategies, the investment philosophy and investment opportunities, please contact:
Arvind Chari – [email protected]
Arvind Chari is the Chief Investment Officer (CIO) at Quantum Advisors. Arvind’s vast experience in managing money for global investors and his interactions with leading institutions has exposed him to a world of knowledge. With over 18 years of experience in tracking domestic and global economy he is Quantum’s thought leader and is the author of this Q-India Insight edition.
Important Disclosures & Disclaimers:
1. Quantum Advisors Private Limited (QAPL) is registered in India and holds a Portfolio Management License from Securities and Exchange Board of India (SEBI), India. It is also registered with the Securities Exchange Commission, USA as an Investment Adviser and a Restricted Portfolio Manager in the Canadian Provinces of British Columbia (BCSC), Ontario (OSC), and Quebec (AMF). It is currently not registered with any other regulator. Registration with above regulators does not imply any level of skill or training
2. This summary is subject to a more complete description and does not contain all of the information necessary to make an investment decision, including, but not limited to, the risks, fee and investment strategies of QAPL.
3. This article is strictly for information purposes only and should not be considered as an offer to sell, or solicitation of an offer to buy interests in the account. Investments in the equity and fixed income instruments are not guaranteed or insured and are subject to investments risks, including the possible loss of the principal amount invested. The value of the securities and the income from them may fall as well as rise. Past performance does not guarantee future results and future performance may be lower or higher than the data quoted, including the possibility of the loss. Quantum Advisors reserves the right to make the changes and corrections to its opinions expressed in the document at any time, without notice. Information sourced from third parties cannot be guaranteed or was not independently verified. Comments made herein are not necessarily indicative of future or likely performance of the account and are based on information and developments as at 30/06/2021 unless otherwise stated.
4. All of the forward-looking statements made in this communication are inherently uncertain and Quantum Advisors (QAPL) cannot assure the reader that the results or developments anticipated by QAPL will be realized or even if realized, will have the expected consequences to or effects on, us or our business prospects, financial condition or results of operations. A prospective investor can generally identify forward-looking statements as statements containing the words “will,” “should”, “can”, “may”, “believe,” “expect,” “anticipate,” “intend,” “contemplate,” “estimate,” “assume”, “target”, “targeted” or other similar expressions. Readers are cautioned not to place undue reliance on these forward-looking statements in making any investment decision. Forward-looking statements made in this communication apply only as of the date of this communication. While we may elect to update forward-looking statements from time to time, we specifically disclaim any obligation to do so, even if internal estimates change, unless otherwise required by applicable Securities law
UK related important disclosures
- The protections conferred by or under the Financial Services and Markets Act (FSMA) will not apply to this newsletter and any ESG based investment activity undertaken by us.
- The protections conferred by or under the FSMA may not apply to any investment activity that may be engaged in as a result of this newsletter.
- The applicability of any dispute resolution scheme or compensation scheme and its jurisdiction (if and where applicable) pertaining to a transaction resulting from this newsletter would be as specified in the respective client agreements.
Blog Posts


- May 01, 2020
Quantum Advisors was founded by Ajit Dayal as India’s first institutional equity research house in January 1990.
Our Strategies
Explore how our two main strategies – Predictable India Equity and India Integrity Equity - with demonstrated success of our tried and tested research and investment processes can ensure your India equity allocation will have higher predictable outcomes and no surprises.
Q India Value Equity Strategy
20+ years of India Long-only, Liquid, High-Governance, Margin of safety = Predictability
Integrity screen since 1996, strategy Track record since 2000.
Q India Responsible Returns Strategy
Liquid, proprietary Integrity Scores, Financial Soundness
Integrity Screen since 1996, enhanced criterion since 2015, strategy Track Record since 2019; strategy AuM: $9.7 mn Mandate Capacity: $5 billion
Quantum Advisors pioneered a quantitative as well as qualitative analytical approach to equity investing in India, providing for the first time, consistently applied valuation metrics to evaluate investment opportunities in India’s emerging stock markets. Over the years, Quantum Advisors has continued and enhanced its tradition of extensive financial analysis and value investing, as it has evolved into an investment advisor and asset manager.
Our investment philosophy and strategy involves the use of intensive qualitative and quantitative fundamental analysis. We build and monitor our clients’ portfolios actively while at the same time avoiding excessive trading, and control risk by endeavoring to keep our clients’ portfolio adequately diversified, both in terms of the sectors included in those portfolios, as well as with respect to the level of concentration in any specific security.