


‘INDIA to TINA’: Private Assets – Is the Over-allocation Justified?
Quantum Advisors India
Building your India portfolio since 1990 on a foundation of ethics, integrity & disciplined investment research process.
June 2, 2023An in-depth analysis of foreign investment trends in India's private and public markets over the past two decades highlights the shift in investment inflows towards private markets, especially post-2020, but a recent slowdown warns of its potential impacts. We critically examine past investment failures and call for greater transparency in the reporting of investment returns, drawing attention to the reality of the current market scenario in India.
Over the last 20 years, ending December 2022, India has received foreign inflows of over USD 400 billion in Private markets (Private Equity (PE), Venture Capital (VC), Infrastructure (IR), Real Estate (RE). The cumulative net investments in Public Markets (Public Equity and Fixed Income) for the same period is about USD 250 billion.
We know the market value of the public investments to be around ~USD 650 billion as we have updated mark-to-market valuation. We can only speculate the market value of the Private market investments.
Chart 1: Foreign Investors have chosen Private Markets over Public
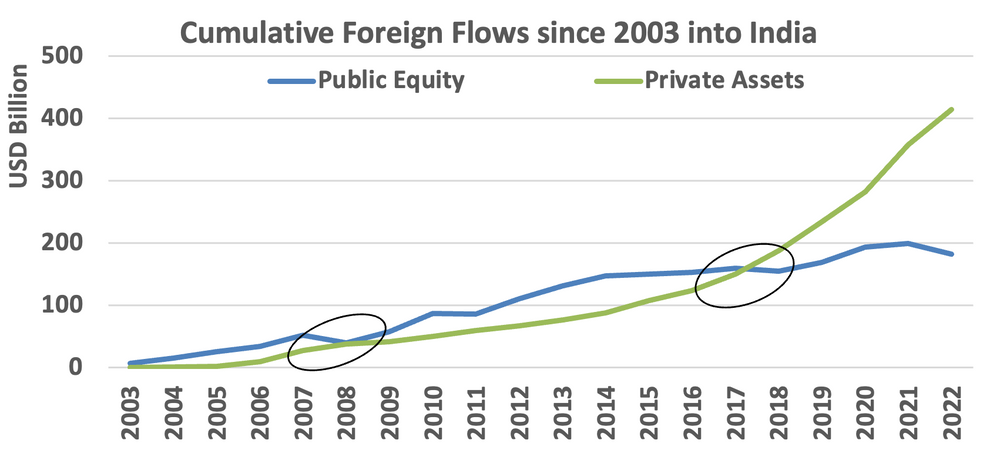
Source: NSDL, IVCA, Private Assets includes Private Equity, Venture, Infrastructure, Real Estate, Private Flows are Gross and does not include exits; Annual Calendar year data till 2022
As the chart above shows, in the period since 2017, the outcome has been stark. Private Assets have seen gross flows of 10x over Public Markets. Even if we account for Exits from Private Assets, the flows on a net basis are 6x higher than Public Markets.
Private Markets are of course larger and the opportunity set is wider. It includes Private Equity, Venture Capital, Infrastructure and Real Estate. It will always attract and absorb more flows than the public markets of Equity and Fixed Income.
It is also a testament to the improving eco-system: growing opportunity, improving management teams and products, exit options. More importantly, the growing active investor base across global PE firms to large pension/SWFs and the rise in India dedicated fund raises.
Chart 2 and 3: China +1 = India in Private Market Investing
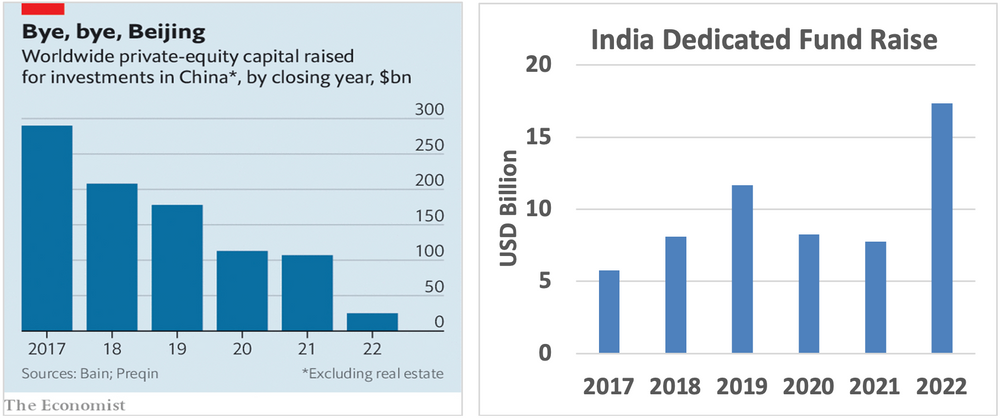
Two bar charts showing private‑equity capital raised for China declining and India‑dedicated fund raises increasing from 2017 to 2022.
Source: Economist, IVCA – EY report
This surge in flows towards India VC investments was seen in 2020/2021, as China clamped down on the Technology sector. Capital raised for China gushed into India, turning many start-ups into Unicorns. For two years in row (2021/22), India has surpassed China in the number of new unicorns created. India has seen 72 unicorns (Valuation of >USD 1 billion) in last 3 years. The pace of course slowed down by late 2022 in what many are now calling the ‘funding freeze’.
Chart 4: A normalised world of rates and liquidity should slow down the optimism
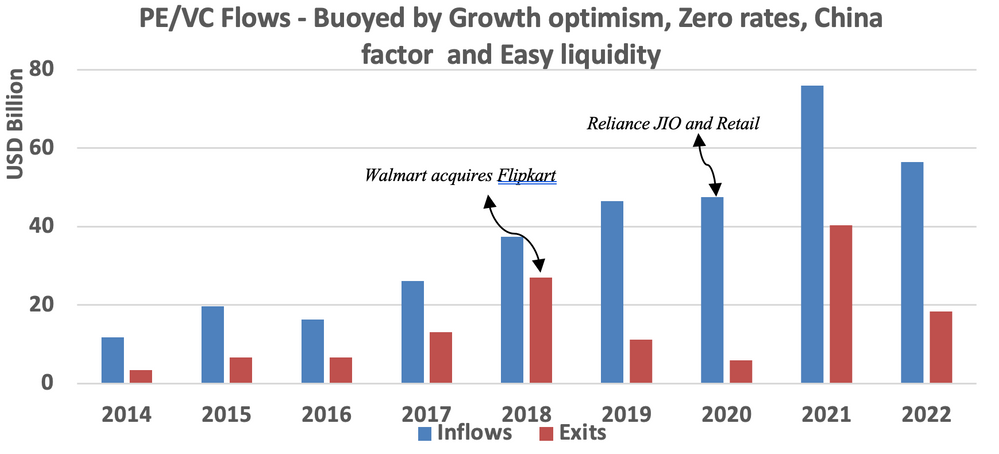
Bar chart showing PE/VC inflows and exits from 2014 to 2022 in US$ billions
Source: IVCA-EY Report
The funding freeze on private assets has already slowed down the deal flow and the gross inflows in 2023. This will also impact the EXITS and the valuation of the assets. Many existing private asset owners are dependent on new flows, new deals to either value the investments and to exit their investments in secondary or strategic transactions.
This is especially true as the recent experience of exits through IPOs haven’t really been taken well by the markets. The chart below has some significant takeaways for private market investors.
Public markets have the appetite to absorb private market exits as seen from data. However, they have now wisened up to the relentless supply that can follow. More than that, they will be very vary of the valuation that they offer to private market investors at the IPO, given the outcome of some of the marquee tech driven VC exits.
Exit options will be better than what it was during the 2010-2016 period. However, it is unlikely to offer the scale and the valuation that private market investors saw in the last 3 years. Valuations of these assets would thus need to reflect this reality sooner than later.
Chart 5: Public Markets are realistic, IPOs and exit valuations will be muted
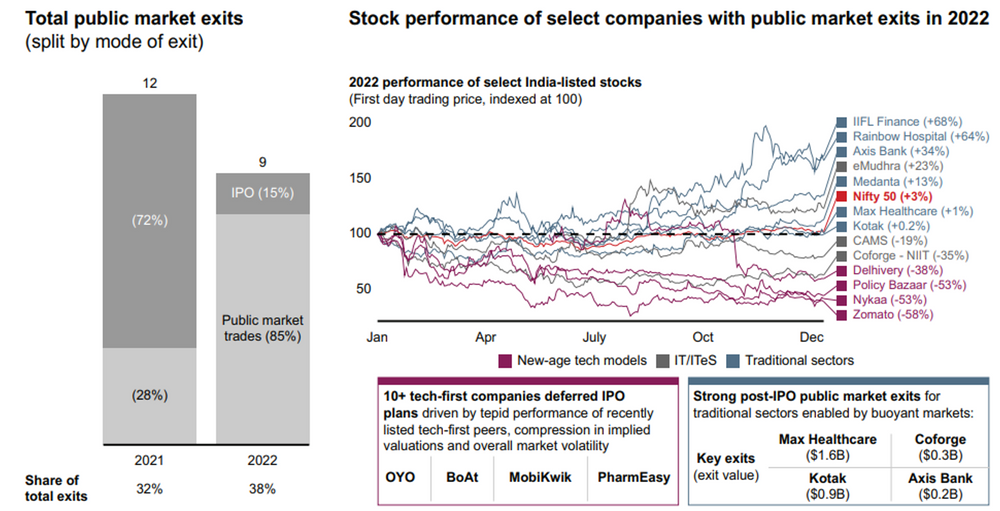
Source: Bain Capital, India PE Report, 2023
India – I will Never Do It Again to TINA – There Is No Alternative
Ask the foreign investors who ploughed money into India Infrastructure and Real Estate between 2006-2012. Most of them would say, I will never invest in India again. Many University endowments who chose PE and/or Small Cap strategies following the BRIC mania, would also have a similar outcome.
Their sordid outcome was a lot to do with mis-guided assessments and expectations:
of Growth; – (India will grow at 9% GDP for many years)
of Liquidity; – (markets will develop, eco-system will improve and the hope that I will exit before others)
and of Returns; – (private markets will offer high double digit dollar returns at all times)
More importantly, it was also about Governance, the headline risks of reputation.
The frenzy to invest due to the TINA factor – almost always condemns the investors to make sub-optimal decisions. They back the wrong project. They back the wrong manager. They do not account for the myriad regulatory and governance risks.
Infrastructure and Real Estate investments in particular was replete with such examples throughout the last decade. Many projects returned single digit returns. Some lost capital. Some were outright frauds with investors stuck in litigation for years.
We may be seeing a lot of that today again. So many of the ‘Unicorns’ backed by the largest PE/VC investors are proving to be a combination of ‘Wirecard’ and ‘Theranos’.
Private Markets is an important investment destination. However, as Chart 1 and 3 show, foreign investor seem way more allocated to Private Markets over Public markets.
The India dedicated fund raise in private markets averaging ~USD 10 billion per year needs to be compared to the cumulative market value of ~USD 40 billion of all off-shore India dedicated funds in public equities.
As an LP, you would know based on your private market IRRs, that the returns though are nothing spectacular as compared to that available in Indian public markets.
We do hope regulators force private market funds to also disclose the time-weighted IRRs of their funds. We don’t have an indexed data series for PE/VC returns in India. The best we have is an EM comparison. As the 5 and 10 year returns show, the returns below are on what should be termed as the best phase of market cycle for private returns.
A large part of the returns would be accounted by strong inflow marking up the valuations. At the same time many will contend that the current valuations do not reflect the reality of higher interest rates and lower inflows into private assets.
Table 1: Is the excess return worth all the risks of over-allocation to PE/VC
High Hurdle rate for private markets
(Returns in INR – Based on Assumptions)
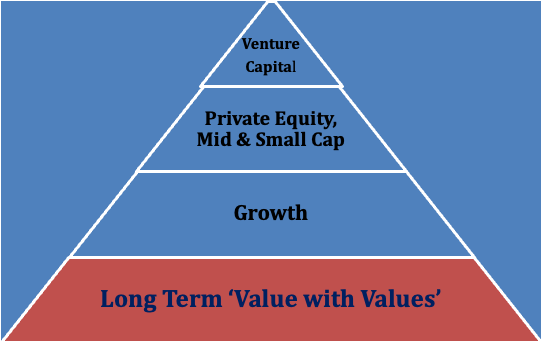
Suggested Building Blocks of India Equity Allocation
Related Post
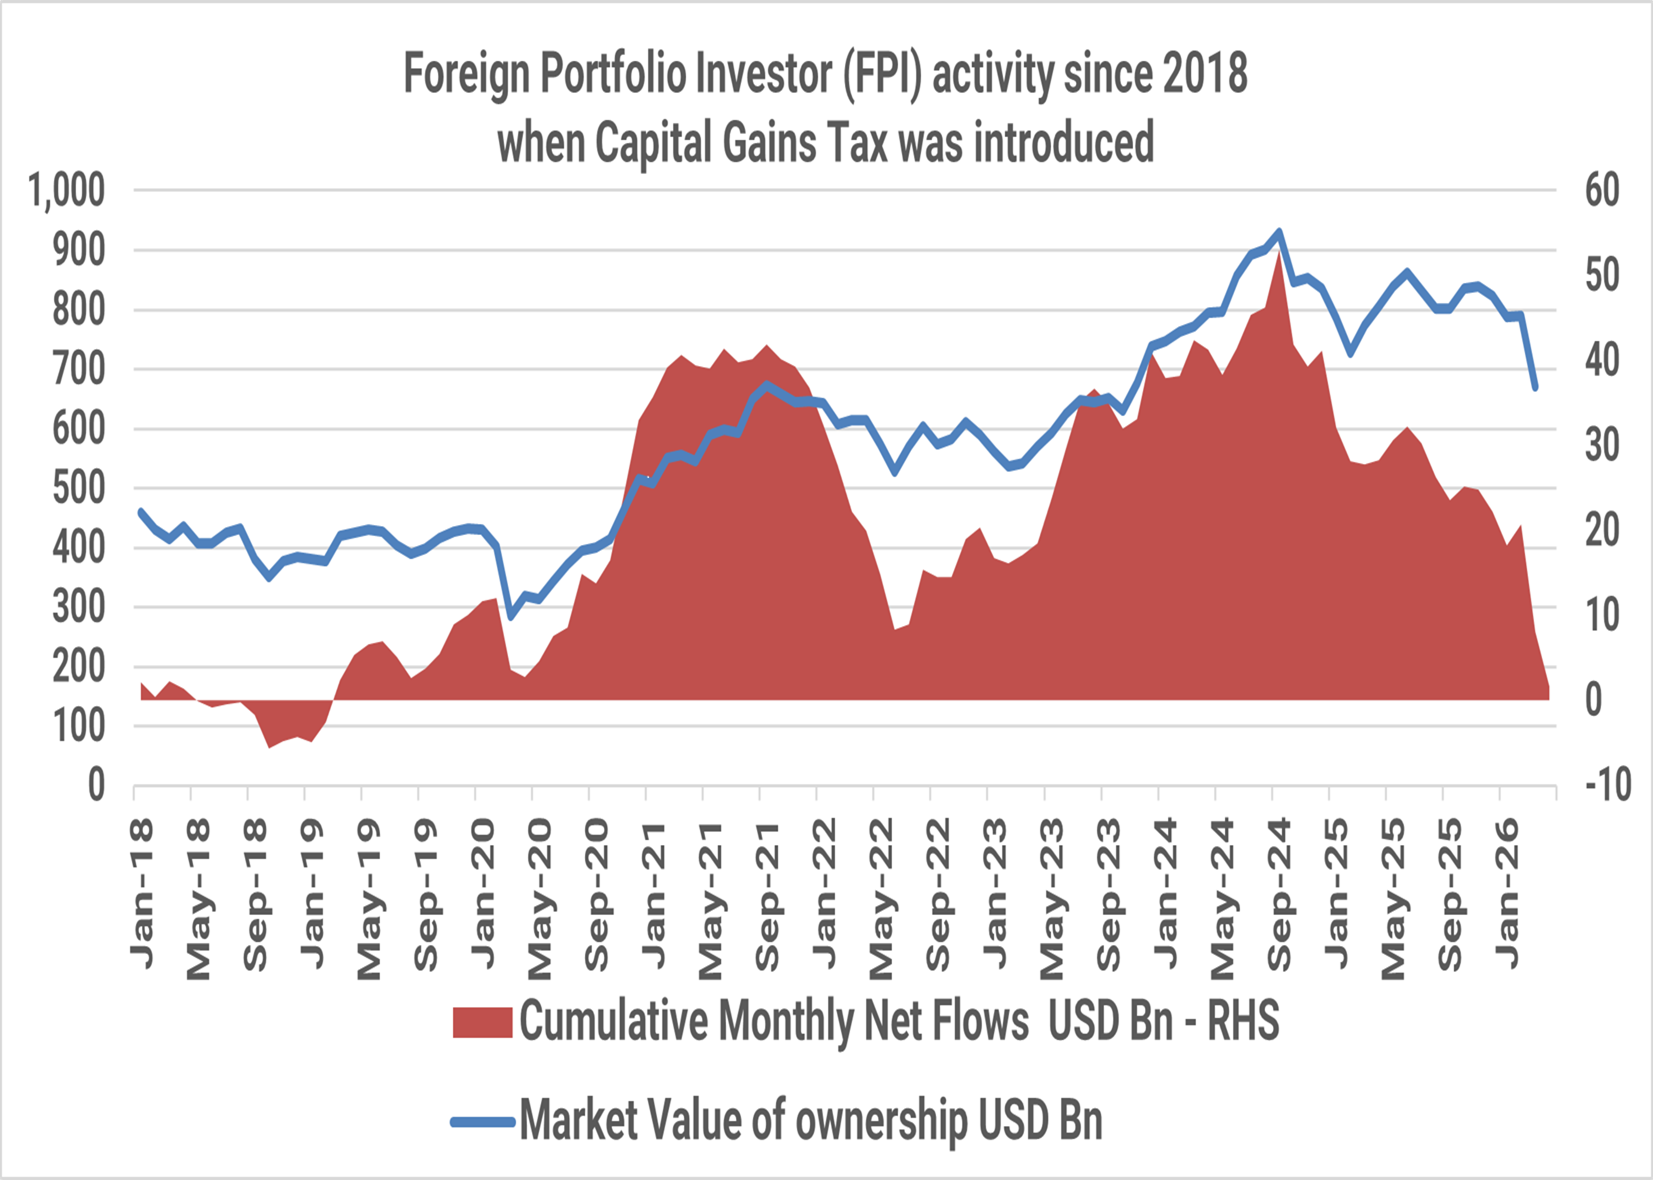
India: T I N A to A N T I
The Indian public equity markets peaked in September 2024. Since then, foreign investors have sold USD 51 billion till April 2026. The market value of foreign investor holding in Indian equities has fallen from USD 930 billion in September 2024 to USD 670 billion, a ~30% drop as at the end of March 2026.

India Investing: From a complicated 2025 to a Simpler 2026?
The simple India investing story of double-digit nominal GDP growth reflecting in stock market returns even in dollar terms has faced some headwinds in 2024/2025. Are these headwinds structural? What should investors expect in 2026?
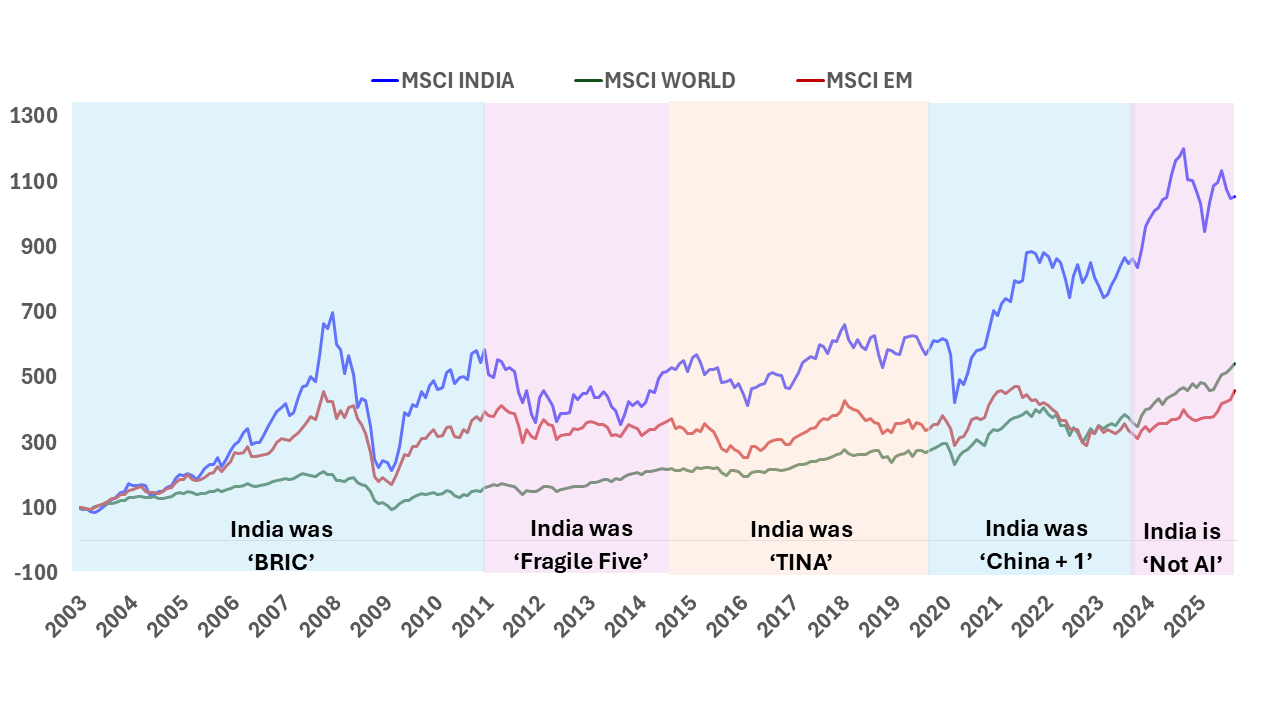
India Investing Under Global Mood Swings
The narrative around global investing is often built around stories. Investors weave these stories around cycles, themes, and opportunities to justify and support their investment rationale.

The Great India Under-Allocation
The most common response to our reach outs to prospective Global Investors to get them interested in Indian Equities is ‘NO’ response.
Our Strategies
Explore how our two main strategies – Predictable India Equity and India Integrity Equity - with demonstrated success of our tried and tested research and investment processes can ensure your India equity allocation will have higher predictable outcomes and no surprises.
Q India Value Equity Strategy
20+ years of India Long-only, Liquid, High-Governance, Margin of safety = Predictability
Integrity screen since 1996, strategy Track record since 2000.
Q India Responsible Returns Strategy
Liquid, proprietary Integrity Scores, Financial Soundness
Integrity Screen since 1996, enhanced criterion since 2015, strategy Track Record since 2019; strategy AuM: $9.7 mn Mandate Capacity: $5 billion
Quantum Advisors pioneered a quantitative as well as qualitative analytical approach to equity investing in India, providing for the first time, consistently applied valuation metrics to evaluate investment opportunities in India’s emerging stock markets. Over the years, Quantum Advisors has continued and enhanced its tradition of extensive financial analysis and value investing, as it has evolved into an investment advisor and asset manager.
Our investment philosophy and strategy involves the use of intensive qualitative and quantitative fundamental analysis. We build and monitor our clients’ portfolios actively while at the same time avoiding excessive trading, and control risk by endeavoring to keep our clients’ portfolio adequately diversified, both in terms of the sectors included in those portfolios, as well as with respect to the level of concentration in any specific security.