


How Green is Green Energy?
Quantum Advisors India
Building your India portfolio since 1990 on a foundation of ethics, integrity & disciplined investment research process.
Jul 26, 2021We look beyond the “clean” label in responsible investing to reveal stark choices for carbon intensity and footprint.
India's electricity generation accounts for ~35% of India's carbon emissions and Coal as a fuel is accountable for ~75% of electricity generation. Even in 2030, Coal is likely to contribute about 50% of electricity generation mix. It is natural for India to focus on renewables to reduce its dependence on coal.
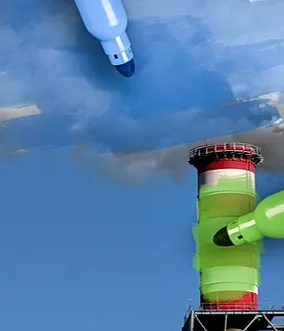
Its unthinkable, India's quest for going green is being challenged by a bird - the Great Indian Bustard. Renewable energy companies have promoted themselves as the 'noble' alternative, what is often missed is their ecological footprint. Amidst the sand dunes of Rajasthan, the tall wind turbines, and lofty steel towers with a promise of clean energy hide a critically endangered bird that has been on a collision course with the power companies' high-tension wires. The frenzy around so-called clean energy often masks the darker side of it, the impact it has on the ecology, biodiversity, or the society.
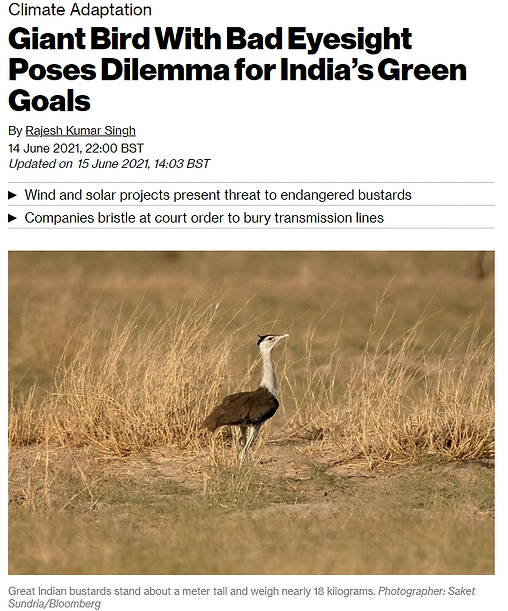
Screenshot of a Bloomberg article titled “Giant Bird With Bad Eyesight Poses Dilemma for India’s Green Goals,” showing a photo of a great Indian bustard standing in dry grassland.
Image Source: Bloomberg Green Article.
While renewables and electric vehicles have an important role to play in in meeting the targets of the Paris Climate Accord, the blind rush to target 100% renewables or 100% electrification of the transportation sector is beset with its own set of problems. While these technologies are upheld as clean and environmentally friendly, there is very little research undertaken on the dark side of green technologies. We believe there are three key aspects on which the “green revolution” needs further introspection -
- Power density
- Resource intensity
- Energy return on energy invested (EROEI)
Power Density
Power density measures the rate of energy production or use per unit of horizontal surface (Watt / m2).⁽¹⁾ In the past, most energy transitions were accompanied by civilizations replacing a less power dense fuel with a higher power dense fuel. These gradual transitions from wood to coal, coal to oil and then to natural gas and uranium did not require any fiscal incentives or government targets. This is usually the case when a more efficient technology replaces a relatively inefficient one. Hydrocarbons may have their critics, but we use them widely because they produce lots of energy at affordable prices, at times when we require and from small spaces.
| Fuel source | Energy Density: Megajoules per kg | Power Density Range: Watts per square meter |
|---|---|---|
| Biomass | 19 Mega J / kg | 0.5 – 2.0 |
| Ethanol | 21 Mega J / kg | 0.2 |
| Wind | 0.4 Micro J / kg | 2.5 |
| Solar | 1.4 Micro J / kg | 4 – 9 |
| Coal | 24 Mega J / kg | 100 – 1,000 |
| Oil | 44 Mega J / kg | 1,000 |
| Gas | 54 Mega J / kg | 200 – 2,000 |
| Nuclear | 3,900,000 Mega J / kg | 1,000 – 2,000 |
In recent times, the energy transition policies and targets are ignoring the lessons of physics. Governments and policy makers are heavily banking on harnessing renewable energy flows that are, in general, significantly lower than the power densities of fossil fuel-based systems.
Consider a developing country like India with per capita electricity consumption of ~ 1,200 units per capita⁽²⁾ and a population of ~1.4 bn ⁽³⁾. Based on current installed power generation capacity, the land use for meeting India's current power requirement is estimated at ~28 mn acres which comprises ~3% of India's total land area of 810 mn acres ⁽⁴⁾.
| Fuel Source | Land footprint (Acres per MW) |
Installed capacity (MW) |
Generation (GWh) |
Estimated land footprint (Mn. Acres) |
Share of land | Share of generation |
|---|---|---|---|---|---|---|
| Coal | 12.2 | 209,805.0 | 981,239 | 2.6 | 9% | 74.8% |
| Natural gas | 12.4 | 24,924.0 | 51,157 | 0.3 | 1% | 3.9% |
| Nuclear | 12.7 | 6,780.0 | 42,949 | 0.1 | 0% | 3.3% |
| Solar | 43.5 | 40,085.4 | 60,402 | 1.7 | 6% | 4.6% |
| Wind | 70.6 | 39,247.1 | 60,150 | 2.8 | 10% | 4.6% |
| Biofuels | 423.8 | 10,314.2 | 16,437 | 4.4 | 16% | 1.3% |
| Hydro | 315.2 | 50,995.8 | 99,941 | 16.1 | 58% | 7.6% |
| Total | 382,151.4 | 1,312,274.4 | 27.9 | 100% | 100% |
https://www.strata.org/pdf/2017/footprints-full.pdf https://www.strata.org/pdf/2017/footprints-full.pdf
https://powermin.gov.in/en/content/power-sector-glance-all-india https://powermin.gov.in/en/content/power-sector-glance-all-india
https://mnre.gov.in/the-ministry/physical-progress https://mnre.gov.in/the-ministry/physical-progress
If India's per capita electricity consumption will be closer to world average of 3,300 kwh⁽⁵⁾ and if renewables are expected to generate ~50% of total electricity, land requirements are expected to substantially increase to 190 mn acres or ~18% of total available land.
| Source | Land footprint (Acres per MW) |
Share of generation | Estimated PLF (%) |
Required generation (GWh) |
Required capacity MW |
Estimated land footprint (Mn. Acres) |
|---|---|---|---|---|---|---|
| Coal | 12.2 | 20.0% | 65% | 716,971.1 | 125,916.9 | 1.5 |
| Natural gas | 12.4 | 15.0% | 65% | 537,728.3 | 94,437.7 | 1.2 |
| Nuclear | 12.7 | 5.0% | 75% | 179,242.8 | 27,282.0 | 0.3 |
| Solar | 43.5 | 25.0% | 17% | 896,213.9 | 601,809.0 | 26.2 |
| Wind | 70.6 | 25.0% | 20% | 896,213.9 | 511,537.6 | 36.1 |
| Biofuels | 423.8 | 5.0% | 18% | 179,242.8 | 113,675.0 | 48.2 |
| Hydro | 315.2 | 5.0% | 22% | 179,242.8 | 93,006.8 | 29.3 |
| Total | 100% | 3,584,856 | 1,567,665.1 | 142.9 |
High land requirements for renewable sources poses serious challenges.
Currently, nearly 51% of India's land is under cultivation, 21.8% under forest and 3.9% under pasture. With ~2% of the World's total land mass, India needs to feed nearly 17% of the world's human population and 17% of the world's cattle population. Even in developed economies such as the US, plans to build large-scale solar plants and wind farms have been opposed for aesthetic and environmental reasons.
Wind farms are coming under increasing scrutiny for their negative impact on wildlife and in particular on rare birds of prey. This is also because while solar power projects are commissioned on contiguous land, wind power projects require scattered land which not only increases the transmission cost but also increases the possibility of interfering and disturbing wildlife habitat.
Resource Intensity
An often-overlooked aspect of solar panels, windmills and electric vehicles is the material intensity of their manufacturing process. The ambitious decarbonization targets will place increased demands on copper, steel, aluminium, various rare earths and composite materials. More attention needs to be given on toxicity of some of these materials and whether processes exist for their recycling or safe disposal.
Each new MW of solar power requires ~130 tons of steel and concrete; each new MW of wind power requires ~450 tons of steel and concrete. Additionally, wind also requires ~ 130 tons of rare earth elements per GW. ⁽⁶⁾
| Materials (Wind power) | Average requirement (Tons per MW) |
Materials (Solar PV) | Average requirement (Tons per MW) |
|---|---|---|---|
| Concrete | 328.3 | Concrete | 60.7 |
| Steel | 119.5 | Steel | 67.9 |
| Polymers | 4.6 | Plastic | 8.6 |
| Glass / carbon composites | 8.1 | Glass | 46.4 |
| Aluminium | 1.1 | Aluminium | 7.5 |
| Boron | 0.0 | Silicon | 4.0 |
| Chromium | 0.5 | Silver | 0.015 |
| Copper | 3.0 | Cadmium | 0.036 |
| Dysprosium* | 0.010 | Tellurium | 0.043 |
| Iron | 19.4 | Copper | 4.6 |
| Manganese | 0.790 | Indium | 0.012 |
| Molybdenum | 0.109 | Gallium | 0.003 |
| Neodymium* | 0.096 | Selenium | 0.025 |
| Nickel | 0.340 | Germanium | 0.041 |
| Praseodymium* | 0.018 | ||
| Terbium* | 0.004 | ||
| Zinc | 5.5 | ||
| Total material | 491 | Total material | 200 |
https://eitrawmaterials.eu/wp-content/uploads/2020/04/rms_for_wind_and_solar_published_v2.pdf
The resource intensity of renewable energies leads to the challenge of their safe disposal. Wind turbine blades are difficult to recycle due to the presence of composite materials and polymers. More often than not, they are disposed in landfills. Solar panels contain lead, cadmium and other toxic metals that cannot be removed completely without breaking the panel. Disposing panels in landfills is problematic due to the risk of toxic materials leaching into the soil. Regulations in developing nations are often not stringent to deal with management of toxic solar waste.
The International Energy Agency (IEA) in their World Energy Outlook 2019 estimates renewables to contribute to 50% of total electricity demand by 2040 in the scenario labelled as “Sustainable Development”. ⁽⁷⁾
| 2019 | 2040 Estimates | ||||
|---|---|---|---|---|---|
| Generation TWh |
Capacity GW |
Generation TWh |
Capacity GW |
PLF estimated |
|
| Fossil fuels | 17,000 | 4,161 | 8,000 | 2,164 | |
| – Coal | 10,000 | 2,118 | 2,000 | 424 | 54% |
| – Gas | 6,000 | 1,740 | 6,000 | 1,740 | 39% |
| – Oil | 1,000 | 303 | - | - | 38% |
| Nuclear | 3,000 | 378 | 4,000 | 504 | 91% |
| Hydro | 4,000 | 1,135 | 7,000 | 1,986 | 40% |
| Renewables | 4,000 | 1,892 | 19,000 | 10,387 | |
| – Wind | 2,000 | 605 | 8,000 | 3,653 | 25% |
| – Solar | 1,000 | 832 | 8,000 | 5,372 | 17% |
| – Others | 1,000 | 454 | 3,000 | 1,362 | 25% |
| Total | 28,000 | 7,566 | 38,000 | 15,041 | |
Based on our calculations, meeting the IEA's estimates will require the current installed wind and solar capacity to substantially increase from ~1,440 gigawatt (GW) today to 16,000 GW by 2040. Due to the low-capacity factor of renewables, the doubling of installed power generation capacity will lead to a generation increase of only 35%. Assuming a 5% replacement rate, the cumulative capacity additions to wind and solar till 2040 stand at 11,700 GW and 15,800 GW, respectively. The buildout of these “clean” energy solutions under the “Sustainable Development” scenario is likely to increase CO2 emissions by at least 10 bn tons. This calculation excludes emissions attributed to developing storage infrastructure, transmission lines, mining of rare earths and transportation related activities.
| Incremental capacity | GW | Cumulative material requirement till 2040 (Bn tonnes) | |||
|---|---|---|---|---|---|
| Steel | Concrete | Aluminium | Glass | ||
| Wind | 11,721 | 1.4 | 3.8 | 0.0 | 0.1 |
| Solar | 15,837 | 1.1 | 1.0 | 0.1 | 0.7 |
| Total | 27,558 | 2.5 | 4.8 | 0.1 | 0.8 |
| Carbon Intensity (per tonne of material) | 1.85 | 0.6 | 16.1 | 1.2 | |
| Estimated increase in emissions (Bn tonnes) | 4.6 | 2.9 | 2.1 | 1.0 | |
High land requirements for renewable sources poses serious challenges.
Sources for carbon intensity assumptions:
- Steel: https://www.mckinsey.com/industries/metals-and-mining/our-insights/decarbonization-challenge-for-steel
- Concrete: https://www.iea.org/reports/cement
- Aluminium: https://www.world-aluminium.org/publications/tagged/carbon%20footprint/
- Glass: https://feve.org/wp-content/uploads/2016/04/FEVE-brochure-Recycling-Why-glass-always-has-a-happy-CO2-ending-.pdf
How Green Are EVs?
Based on Jefferies research (Are EVs as "Green" as They Appear?), a typical EV is on average 50% heavier than a similar internal combustion engine vehicle.⁽⁸⁾ This is due to the additional copper in motors and wiring, large battery packs due to the low power density and heavier regenerative braking systems. This results in the “embedded carbon” in an EV being 20-50% more than an internal combustion engine. The higher embedded carbon leads to an EV achieving emissions parity with an ICE engine only after being driven for 135,000 miles. This is a problem right now since batteries are typically replaced after ~ 120,000 miles. For achieving true emission reductions, battery technology needs to progress further to bring about meaningful change in carbon emissions.
Many of the electric vehicles on the market use kilograms of magnetic materials to drive their electric motors. These magnets are typically made with rare-earth materials such as neodymium and dysprosium. Separating the rare earth materials from their ores requires huge amounts of carcinogenic compounds like sulphate, ammonia and hydrochloric acid. Processing 1 ton of rare earths can produce up to 2,000 tons of toxic waste ⁽⁹⁾. Questions also need to be asked on what is likely to happen to the lithium batteries at the end of their life. While traditional lead-acid batteries are widely recycled, the same can't be said for the lithium-ion versions used in electric cars.
Source of electricity generation matters a lot when it comes to setting policies on electric vehicle adoption. In countries or states where electricity is predominantly fossil fuel based, hybrids may have a lower carbon footprint that all electric vehicles. In the US State of Missouri which derives 70% of electricity from coal, a hybrid vehicle will lower carbon emissions by 45% compared to an ICE vehicle whereas an electric vehicle will lower the emissions by 35% compared to an ICE vehicle ⁽¹⁰⁾.
Energy Return on Energy Invested (EROEI)
The true quality of any energy source is demonstrated by its energy return on energy invested (EROEI) i.e. the ratio of energy returned to energy invested in that energy source, along its entire lifecycle. When the number is large, energy from that source is easy to get and cheap. However, when the number is small, the energy from that source is difficult to get and expensive.
An energy system must produce a surplus large enough to sustain things like food production, transportation, manufacturing, infrastructure development, entertainment, etc. Certain research studies have calculated that for economies to improve their standard of living, the EROEI needs to be higher than 30.⁽¹¹⁾
| EROEI | Quality of Life |
|---|---|
| < 25 : 1 | poor / moderate quality of life |
| 20 < EROEI < 30 | threshold of well being |
| EROEI > 30 | Improvement in well being |
https://www.sciencedirect.com/science/article/pii/S0301421513006447
Any planned change in the energy mix should take into account the resultant impact on the well-being of society at large. Currently IEA's “Sustainable Development” scenario leads to a decline in World average EROEI from ~ 30 to ~ 22.
| EROEI | Electricity generation mix and resultant EROEI IEA Sustainable Development |
|||
|---|---|---|---|---|
| World: 2019 | India: 2021 | 2040 | ||
| Nuclear | 75 | 10.7% | 3.3% | 10.5% |
| Hydro | 35 | 14.3% | 7.6% | 18.4% |
| Coal | 30 | 35.7% | 74.8% | 5.3% |
| Gas | 28 | 21.4% | 3.9% | 15.8% |
| Wind | 4 | 7.1% | 4.6% | 21.1% |
| Biomass | 4 | 3.6% | 1.3% | 7.9% |
| Solar PV | 2 | 3.6% | 4.6% | 21.1% |
| Combined EROEI | 30.3 | 29.0 | 21.9 | |
EROEI source: https://www.forbes.com/sites/jamesconca/2015/02/11/eroi-a-tool-to-predict-the-best-energy-mix/
It is unlikely that the developed world is prepared for such a drop in the standard of living and unfair to expect a developing economy like India to lower its EROEI. Until we find realistic solutions or technologies to overcome the problems faced by renewables on efficiency and their disposal, there is a high risk of the green revolution falling off a cliff.
Investing By Carbon Intensity Footprint
ESG investing needs to move beyond the overly simplistic exercise of labelling energy sources as “clean” or “dirty”. Every energy source has a certain environmental and social footprint that needs careful consideration considering the stage of development of an economy. Ranking a fund high on ESG credentials solely because of higher exposure to renewables and/or electric vehicle themes may not necessarily provide the complete picture.
The Q India Responsible Returns ("QIRR") Strategy takes the above factors into consideration and refrains from developing an exclusion list based solely on the carbon intensity of an energy source. We prefer to engage with companies that currently have a high carbon footprint and nudge them towards adopting science-based targets to improve their carbon intensity aligning with the goals of the Paris Agreement. Based on our analysis of our portfolio companies we expect the carbon intensity to decline from current levels of ~570 tonnes / $ mn revenues to 310 tonnes / $ mn revenues.
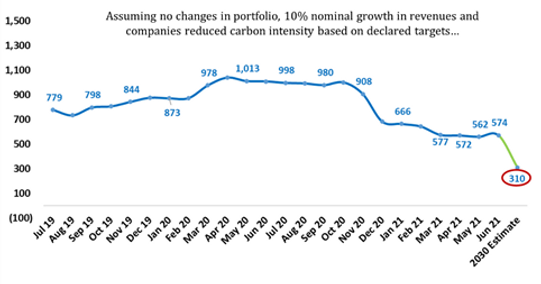
Line chart showing a company portfolio’s carbon emissions trend from July 2019 to June 2021, with a projected 2030 estimate.
Source:
Nations need to think carefully before committing vast sums of money on technologies that are perceived as clean and not focus solely on carbon intensity as the sole attribute to measure the environmental impact of power generation technologies. Power systems must be planned to meet peak demand. Due to the lower and variable capacity factors of wind and solar, excess capacity needs to be built to generate the necessary electricity. Creating these additional “buffers” leads to a very low energy return on energy invested (EROEI) which also impacts their carbon emissions.
Policies on electrification of transport should also be in sync with the carbon intensity of electricity generation. High penetration of all electric vehicles in regions where electricity is predominantly coal based is likely to have a higher carbon footprint than hybrid vehicles.
The power density of a fuel determines its true environmental and health impact, and this should be an important consideration in planning the power generation mix.
Sources
- Gradual Greening: Power Density and the Hydrocarbon Habit (PDF)
- https://www.moneycontrol.com/news/trends/current-affairs-trends/indias-per-capita-power-consumption-rising-but-wide-variations-persist-across-states-6663841.html
- https://datacommons.org/place/country/IND?utm_medium=explore&mprop=count&popt=Person&hl=en
- https://www.indiawaterportal.org/articles/land-use-map-india-national-institute-hydrology
- https://ourworldindata.org/grapher/per-capita-electricity-consumption
- Raw Materials Supply for Wind and Solar Technologies (PDF)
- https://www.iea.org/reports/world-energy-outlook-2019/renewables#abstract
- https://blog.gorozen.com/blog/exploring-lithium-ion-electric-vehicles-carbon-footprint
- https://www.techdump.org/rare-earth-metals-recycle-technology
- https://afdc.energy.gov/vehicles/electric_emissions.html
- https://www.sciencedirect.com/science/article/pii/S0301421513006447
- https://www.forbes.com/sites/jamesconca/2015/02/11/eroi-a-tool-to-predict-the-best-energy-mix/?sh=6da483dca027
- https://www.cnet.com/news/figuring-land-use-into-renewable-energy-equation/
- https://www.carbonbrief.org/bird-death-and-wind-turbines-a-look-at-the-evidence
- https://www.downtoearth.org.in/news/wildlife-biodiversity/wind-turbines-kill-birds-of-prey-in-western-ghats-62048
- https://india.mongabay.com/2020/11/wind-solar-parks-conflicts-galore-but-india-wants-more/
- https://www.idtechex.com/en/research-article/will-rare-earths-be-eliminated-in-electric-vehicle-motors/21972
Related Post
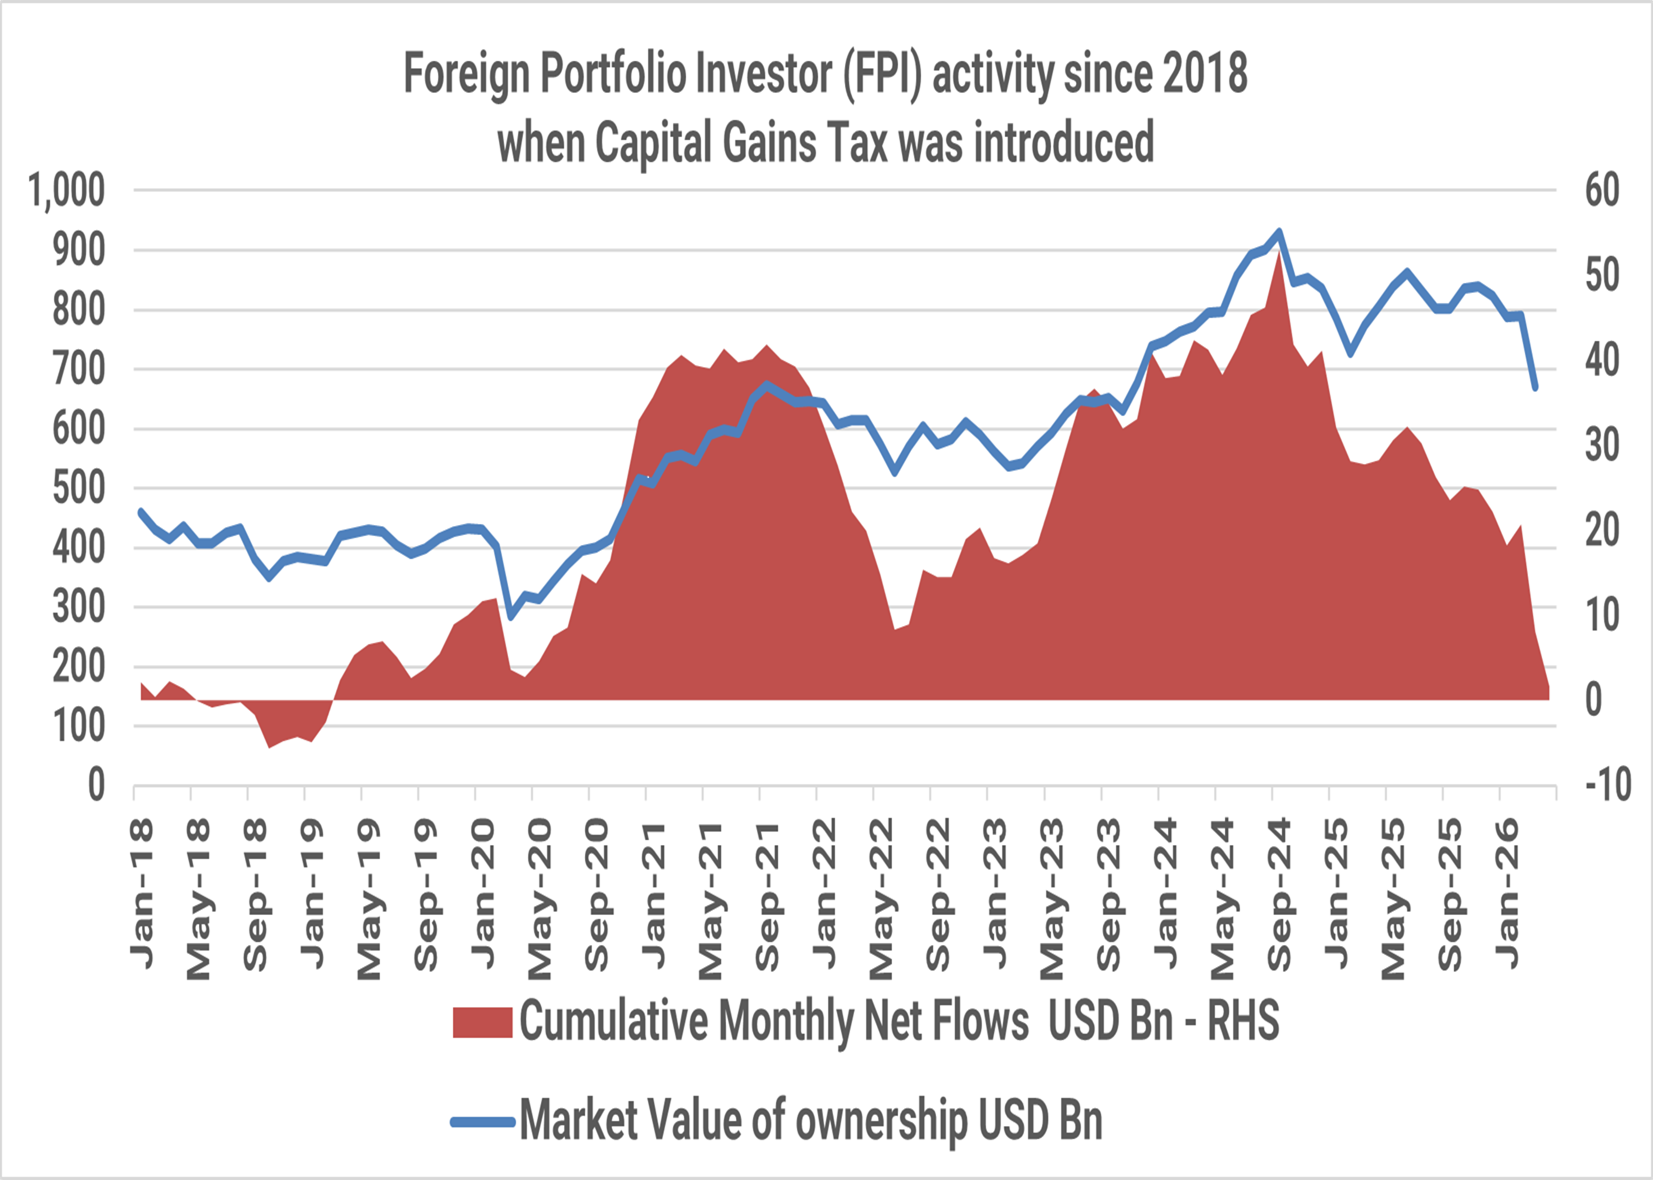
India: T I N A to A N T I
The Indian public equity markets peaked in September 2024. Since then, foreign investors have sold USD 51 billion till April 2026. The market value of foreign investor holding in Indian equities has fallen from USD 930 billion in September 2024 to USD 670 billion, a ~30% drop as at the end of March 2026.

India Investing: From a complicated 2025 to a Simpler 2026?
The simple India investing story of double-digit nominal GDP growth reflecting in stock market returns even in dollar terms has faced some headwinds in 2024/2025. Are these headwinds structural? What should investors expect in 2026?
India Investing Under Global Mood Swings
The narrative around global investing is often built around stories. Investors weave these stories around cycles, themes, and opportunities to justify and support their investment rationale.

The Great India Under-Allocation
The most common response to our reach outs to prospective Global Investors to get them interested in Indian Equities is ‘NO’ response.
Our Strategies
Explore how our two main strategies – Predictable India Equity and India Integrity Equity - with demonstrated success of our tried and tested research and investment processes can ensure your India equity allocation will have higher predictable outcomes and no surprises.
Q India Value Equity Strategy
20+ years of India Long-only, Liquid, High-Governance, Margin of safety = Predictability
Integrity screen since 1996, strategy Track record since 2000.
Q India Responsible Returns Strategy
Liquid, proprietary Integrity Scores, Financial Soundness
Integrity Screen since 1996, enhanced criterion since 2015, strategy Track Record since 2019; strategy AuM: $9.7 mn Mandate Capacity: $5 billion
Quantum Advisors pioneered a quantitative as well as qualitative analytical approach to equity investing in India, providing for the first time, consistently applied valuation metrics to evaluate investment opportunities in India’s emerging stock markets. Over the years, Quantum Advisors has continued and enhanced its tradition of extensive financial analysis and value investing, as it has evolved into an investment advisor and asset manager.
Our investment philosophy and strategy involves the use of intensive qualitative and quantitative fundamental analysis. We build and monitor our clients’ portfolios actively while at the same time avoiding excessive trading, and control risk by endeavoring to keep our clients’ portfolio adequately diversified, both in terms of the sectors included in those portfolios, as well as with respect to the level of concentration in any specific security.