


Quantum Advisors India
Building your India portfolio since 1990 on a foundation of ethics, integrity & disciplined investment research process.
Our 2021 India Investment trends and outlook was premised on a) global central banks keeping rates low and easy liquidity; b) global fiscal stimulus will continue and prop up growth; and c) low cost of capital and better growth prospects will lead investors to search for yield and growth driving capital into growth assets and emerging markets.
Well, Capital did flow chasing growth and returns.
In 2021, Global inflows into public equities of ~USD 1 trillion exceeded the combined net flows (as per BofA research) of the previous 19 years. Global Private Assets continued its bull run. 2021 turned out to be another year of USD 1 trillion of global fund raise for Private Equity, Private Credit, Real Estate and Infrastructure.
Global Venture investing came on its own in 2021. More than ~USD 600 billion of venture capital (VC) investment activity (2x of 2020) was reported and more importantly it was across geographies and attracted new investors. The size of the VC investments is staggering considering these market opportunities are not as deep as traditional public and private markets. That also explains the froth in valuation of start-ups.
India was also a key beneficiary of these flows. In fact, the VC investment boom in India was the biggest stand-out. As per VC Circle, data since 2011 shows that India now has 83 Unicorns (start up ventures with a valuation of USD 1 billion); 44 of those achieved that status in 2021. Total PE/VC investments in India in 2021 is estimated at ~75 billion of which VC was ~USD 35 billion. These are large flows which have essentially gone into building new Indian businesses, brands and markets. This bodes well for India’s economic recovery.
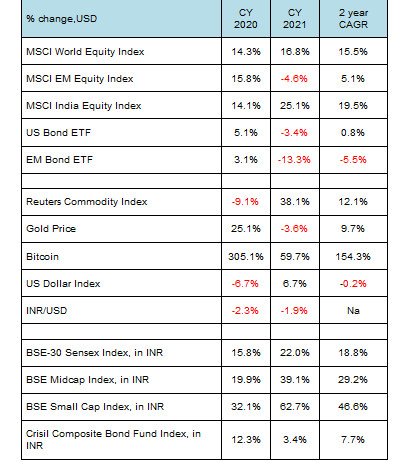
( Refinitiv, US Bond = AGG ETF, EM Bond = JP Morgan Local currency ETF; Crisil indices)
For the first time in more than 5 years, we are getting positive about the prospects of the Indian economy.
In our recent piece, India on the Cusp of a Sustained Economic Revival , we listed down five tailwinds which in the near-term, with some good luck and some sane policy making, can help get India’s real GDP growth above its 6.0%-6.5% trend level.
Government shedding its fiscal conservatism and supporting growth over the medium-term
- Government shedding its fiscal conservatism and supporting growth over the medium-term.
- India’s twin balance sheet problem of over-leveraged corporates and a stressed banking system mending its way into shape and positioned well to fund investments and capex.
- Global growth driving Indian exports and capex recovery.
- Residential real estate showing the first signs of recovery as a potential growth multiplier.
- Availability of global capital, especially as the world looks to ‘China Plus One’.
- Economic Growth is important, not only for asset returns but also for macro stability. High and sustained economic growth has led to high relative returns from Indian assets over time.
We see these trends playing out over the medium term and not necessarily in 2022. Asset returns and investor flows may follow a calendar pattern, economic cycles do not. However, asset markets do price in eventual economic cycles ahead of time. We may be seeing the equity markets and the earnings estimates pricing in some aspects of these tailwinds.
Table 2: Q India Multi Asset Summary

(* - Real Estate is offered by Quantum’s affiliate Primary Real Estate Advisors)
Indian Equities: Premium Valuation for Strong Earnings Profile
The global economic rebound has been very encouraging. The pattern of the recovery, with the support of monetary as well as fiscal spending, should mean that the trend can continue for a while. The signs of an increase in global trade which is triggering global capex as well is leading to comparisons to the 2003-2007 growth phase. Even the rise in commodity prices from the lows of 2020 is similar to the rise seen from the lows of 2002 through to 2005. Global equities thrive in such a period of good growth and reasonable inflation.
Indian Equities did very well in the 2003-2007 period. The chart 1 below suggests, as long as the inflation was manageable, Indian Equities outperformed emerging markets and China. Of course, over the long-term now, Indian equities has continued its significant out-performance over EM and China.
Chart 1 and 2: India is Expensive for a reason: quality of companies; earnings and now domestic flows
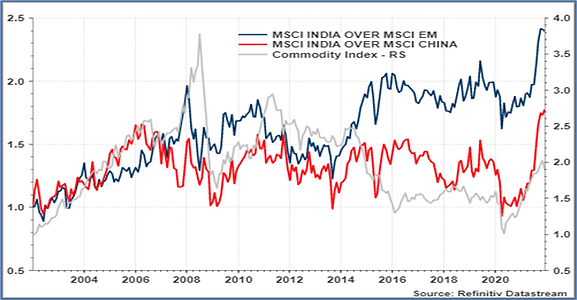
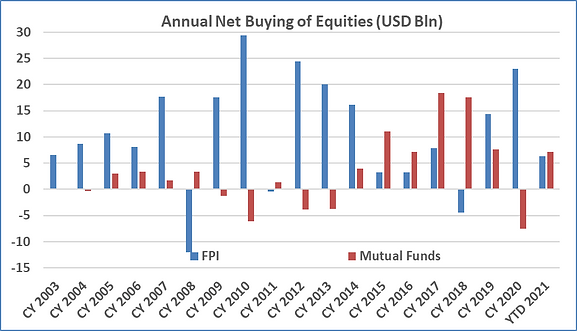
(Source: chart 1 -Datastream; rebased performance of indices shows India’s relative performance; chart 2- Bloomberg Finance L.P, YTD 2021 till November 2021; FPI – Foreign Portfolio Investors)
The extent of the recent out performance may make some investors to allocate away from India into other under-performing markets. Also, the P/E of the BSE-30 Sensex does suggest over-valuation. We should not be surprised by some relative under performance. Also, a further sharp rise in commodity prices and/or a hawkish US FED could see market sell-offs.
However, that we believe would be an opportunity to increase your India Equity allocation. If the tailwinds that we highlighted above play out and we are indeed in the 2003-2007 cycle, then Indian equities and Indian corporate earnings have a long way to go. For the first time in over 5 years, we are seeing consensus earnings estimates being upgraded. Since 2014, as the nominal GDP growth slowed down, we would see analysts cut their year end EPS targets. For about 4 years, the BSE-30 Sensex earnings was flat. However, in 2020 and 2021, companies are beating sell-side estimates making them upgrade their estimates.
Chart 3 and 4: Indian Corporates may be entering a strong earnings cycle
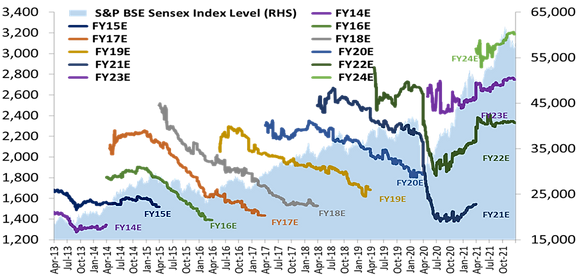
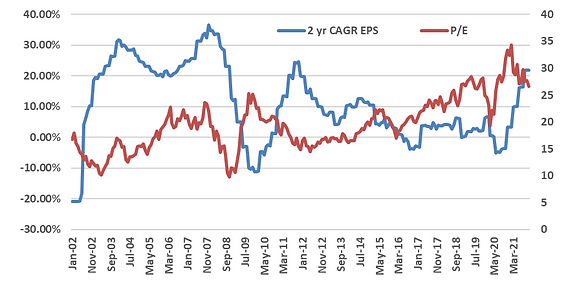
(Source: Bloomberg finance L.P for BSE-30 Sensex, EPS and P/E; chart 4 – trailing eps and p/e ; data till November 2021)
We last saw this trend in 2003-2007 period, where companies buoyed by global and domestic demand were reporting strong earnings and consistently beating estimates. That also has a lesson from a valuation perspective. If the cycle indeed extends, current seemingly expensive valuations are indeed not that expensive
The Quantum Value portfolio, in particular, is cognizant of this trend and is tilted towards cyclical stocks. Despite, market near record peaks, the less than 10% cash levels in the portfolio suggests that the portfolio companies are expected to post higher earnings and have potential upsides.
Table 3: Quantum can help with your India Equity Allocation
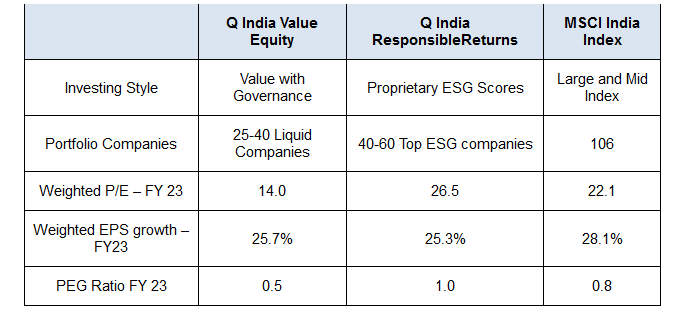
(Source: Quantum Advisors, Bloomberg Finance L.P; Data as for November end Portfolio)
Indian Residential Real Estate – early signs of a turnaround
Indians buying and building houses is by far the most important economic activity. From land sales to the planning and designing, construction and house furnishings and the other side of developer and mortgage financing and taxes, it generates value across the economic value chain. This activity peaked in 2012-13 one major reason for economic slowdown and we may be seeing the first signs of a turnaround.
Decade low interest rates, better affordability, lower or stagnant prices are finally conjuring together to ease the burden of the real estate developers. Given the stress on real estate since demonetisation and exacerbated by the funding crisis, new house building stock was severely restricted. Sales are finally picking up and Inventory levels, as per industry data, has now fallen across Tier-1 and even in Tier-2 towns.
Chart 5 and 6: Residential stress falling; Opportunity to deploy large capital
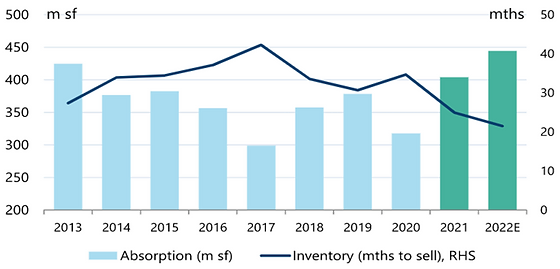
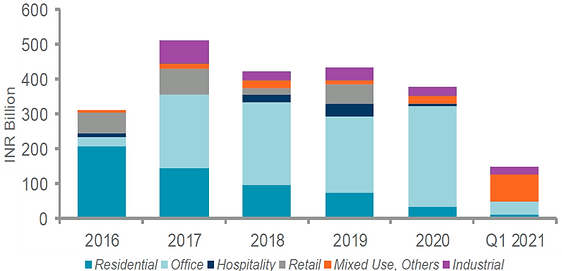
(Source: Chart 5- Jefferies research; Chart 6 - Cushman and Wakefield)
Although the prime listed real estate companies have rallied quite a bit, the opportunity however to deploy capital on the ground in projects yet provides a decent valuation, margin of safety and with some luck some tailwinds. Indian Real Estate also provides long-term global institutional investors an avenue to deploy capital at a large scale. India has seen large flows into commercial and logistics space over the last 10 years.
Quantum’s affiliate, Primary Real Estate Advisors’ believes the timing is about right to now re-look at a) real estate credit by taking out stressed developers/financers and b) funding new residential housing projects.
India Fixed Income – The Great Divergence
We see a year of divergence and thus volatility in Indian fixed income;
1.Divergence in returns as cash and equivalents do well as rates rise; but the short to intermediate segments struggle
2.Divergence in the actions of the RBI and the expectations of the bond market
3.Divergence in global Central Bank’s EXIT policies impacting flows and thus asset prices and currency
Chart 7 and 8: India’s likely inclusion in the bond index will be the key trigger for Indian fixed income
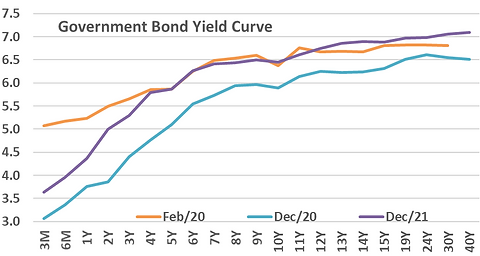
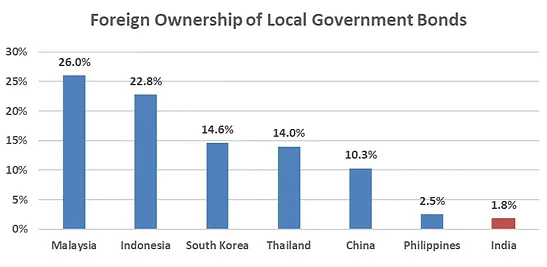
Source – Chart 7 – Refinitiv, Data till 31st December 2021; Chart 8 - www.asianbondsonline.adb.org, RBI, Data for Thailand and Korea are as of March 31, 2021, all others are as of June 30, 2021
The yield curve will get flatter over the course of the year as RBI normalises monetary policy. If India gets included in any global bond index, then we may see foreigners positioning in the 5-10 year curve which has the maximum available limits and bonds for foreigners to buy. That then will have an impact on the shape of the yield curve and intermediate bond returns.
Foreign investors can buy more than ~USD 200 billion of Indian government bonds if they wish to. They currently own less than USD 40 billion in government and corporate bonds and have been net sellers for the last 3 years. So, yes if indeed the bond index drives more investments, Indian bond markets will eagerly accept it.
At Quantum, we have always held that at this stage of the development of the Indian bond markets, foreigners should focus on the safe and liquid sovereign and quasi-sovereign space which can absorb large flows.
Inflation and Hawkish FED will take some sheen away from the Indian Rupee
As the below chart shows, the Indian rupee and hence much of the India macro over the last 5 years was buffered by the fall, in particular of oil prices and in general of global hard and soft commodities. India is a net importer of oil and a net price taker of global commodities.
The circled area on the chart below shows that as commodity prices were benign and as India recovered from the ‘fragile five’ connotation of 2013, the Indian Rupee moved about lesser than other EMs since 2016. The INR has faced a gradual depreciation, but the movements could almost be predicted. As the Current Account improved (less negative) and capital inflows picked up, the RBI has amassed dollars taking the pile of FX reserves to ~USD 650 billion. The RBI is thus in a position today to manage volatility.
Chart 9 and 10: Not Fragile, but Oil prices and global inflation will lead to volatile and depreciating INR
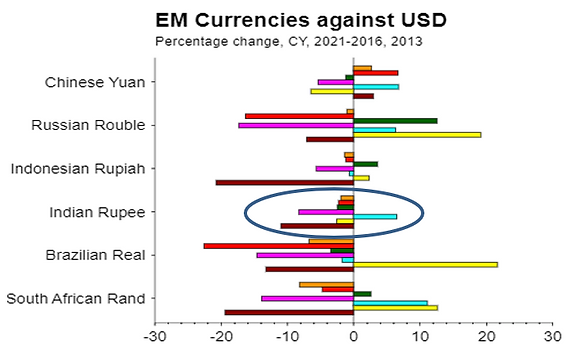
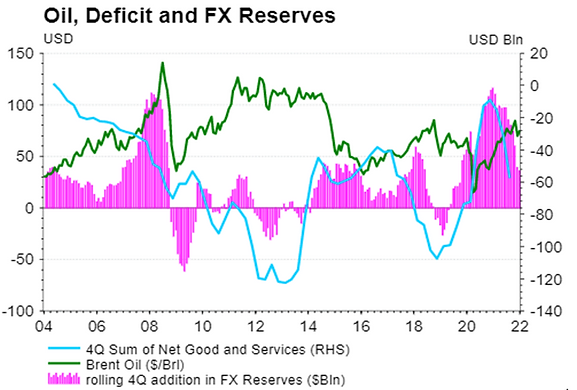
(Source: Chart 9 – Refinitiv, CY % change for 2021 (orange); 2020 (Red); 2019 (green); 2018 (pink); 2017 (aqua) to 2016 (yellow) and 2013 (maroon); Chart 10 – Refinitiv, data till September 2021 for net exports)
However, given the rise in commodity prices and particularly of Oil, as chart 10 depicts it is already leading to a rising deficit in the current account. If we face a period of capital outflows or lower inflows, which is possible this year given the US FED outlook, we will see the INR under pressure. The RBI may be able to smoothen the volatility but will not be able to change the trend. So, investors should assume a volatile and a larger depreciation than 2020 and 2021 for INR in 2022.
For more information and if you wish to discuss the details in the article or if you wish to know more about our investment strategies, the investment philosophy and investment opportunities, please contact:
Arvind Chari – [email protected]
Arvind Chari is the Chief Investment Officer (CIO) at Quantum Advisors. Arvind’s vast experience in managing money for global investors and his interactions with leading institutions has exposed him to a world of knowledge. With over 18 years of experience in tracking domestic and global economy he is Quantum’s thought leader and is the author of this Q-India Insight edition.
Important Disclosures & Disclaimers:
1. Quantum Advisors Private Limited (QAPL) is registered in India and holds a Portfolio Management License from Securities and Exchange Board of India (SEBI), India. It is also registered with the Securities Exchange Commission, USA as an Investment Adviser and a Restricted Portfolio Manager with the Canadian Provinces of British Columbia (BCSC), Ontario (OSC), and Quebec (AMF). It is currently not registered with any other regulator. Registration with above regulators does not imply any level of skill or training
2. This summary is subject to a more complete description and does not contain all of the information necessary to make an investment decision, including, but not limited to, the risks, fee and investment strategies of QAPL.
3. This article is strictly for information purposes only and should not be considered as an offer to sell, or solicitation of an offer to buy interests in the account. Investments in the equity and fixed income instruments are not guaranteed or insured and are subject to investments risks, including the possible loss of the principal amount invested. The value of the securities and the income from them may fall as well as rise. Past performance does not guaran.tee future results and future performance may be lower or higher than the data quoted, including the possibility of the loss. Quantum Advisors reserves the right to make the changes and corrections to its opinions expressed in the document at any time, without notice. Information sourced from third parties cannot be guaranteed or was not independently verified. Comments made herein are not necessarily indicative of future or likely performance of the account and are based on information and developments as at 05/01/2022 unless otherwise stated
4. All of the forward-looking statements made in this communication are inherently uncertain and Quantum Advisors (QAPL) cannot assure the reader that the results or developments anticipated by QAPL will be realized or even if realized, will have the expected consequences to or effects on, us or our business prospects, financial condition or results of operations. A prospective investor can generally identify forward-looking statements as statements containing the words “will,” “should”, “can”, “may”, “believe,” “expect,” “anticipate,” “intend,” “contemplate,” “estimate,” “assume”, “target”, “targeted” or other similar expressions. Readers are cautioned not to place undue reliance on these forward-looking statements in making any investment decision. Forward-looking statements made in this communication apply only as of the date of this communication. While we may elect to update forward-looking statements from time to time, we specifically disclaim any obligation to do so, even if internal estimates change, unless otherwise required by applicable Securities law
UK related important disclosures
• The content of this newsletter has not been approved by an authorised person within the meaning of the Financial Services and Markets Act 2000 (“FSMA 2000”). Reliance on this newsletter for the purpose of engaging in any investment activity may expose you to a significant risk of losing all of the property or other assets you invest or of incurring additional liability. This newsletter is exempt from section 21 FSMA 2000 on the grounds that it is directed only to certified sophisticated investors, high net worth companies, unincorporated associations, trusts and/or investment professionals within the meaning of the Financial Services and Markets Act 2000 (Financial Promotion) Order 2005 (“FPO”). The investment activity described in this newsletter is only available to these persons or entities and no other person or entity should rely on the contents of this document.
• The protections conferred by or under the Financial Services and Markets Act (FSMA) will not apply to this newsletter and any investment activity that may be engaged in as a result of this newsletter
The applicability of any dispute resolution scheme or compensation scheme and its jurisdiction (if and where applicable) pertaining to a transaction resulting from this newsletter would be as specified in the respective client agreements.
Related Post


Our History
Quantum Advisors was founded by Ajit Dayal as India’s first institutional equity research house in January 1990.

Our Strategies
Explore how our two main strategies – Predictable India Equity and India Integrity Equity - with demonstrated success of our tried and tested research and investment processes can ensure your India equity allocation will have higher predictable outcomes and no surprises.
Q India Value Equity Strategy
20+ years of India Long-only, Liquid, High-Governance, Margin of safety = Predictability
Integrity screen since 1996, strategy Track record since 2000.
Q India Responsible Returns Strategy
Liquid, proprietary Integrity Scores, Financial Soundness
Integrity Screen since 1996, enhanced criterion since 2015, strategy Track Record since 2019; strategy AuM: $9.7 mn Mandate Capacity: $5 billion
Quantum Advisors pioneered a quantitative as well as qualitative analytical approach to equity investing in India, providing for the first time, consistently applied valuation metrics to evaluate investment opportunities in India’s emerging stock markets. Over the years, Quantum Advisors has continued and enhanced its tradition of extensive financial analysis and value investing, as it has evolved into an investment advisor and asset manager.
Our investment philosophy and strategy involves the use of intensive qualitative and quantitative fundamental analysis. We build and monitor our clients’ portfolios actively while at the same time avoiding excessive trading, and control risk by endeavoring to keep our clients’ portfolio adequately diversified, both in terms of the sectors included in those portfolios, as well as with respect to the level of concentration in any specific security.